It could be said that 2015 was a year of consolidation for the Bitcoin crypto currency giant. Since the beginning of 2015 the Bitcoin price was bouncing up and down between the areas of $180 and $280. Yet, this hesitation was impaired in the beginning of November. The 7-month high from July was outreached at the end of October, pushing the Bitcoin price toward a new 15-month high in the middle of December.
===
H4 Bitcoin Price Analysis
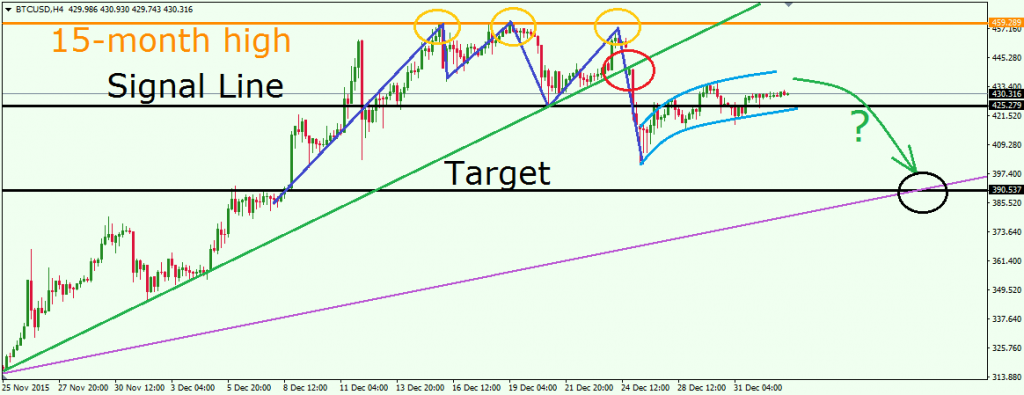
This is the H4 chart of the BTC/USD pair showing the recent bullish trend of the price, marked with green. As you see, after reaching a 15-month high, the price confirms a triple top pattern (blue) with breaking the signal line of the formation. Bitcoin then turns bearish and the green trend gets broken in a bearish direction on Dec 26, 2015. After dropping to $400.90 BTC/USD starts a corrective movement, marked with light blue. As you see, the tops and the bottoms of the followed increase are closing lower and lower, which infers about a new decrease.
This is when it is time to mention the purple bullish trend line, which was established at the beginning of October. Since we have a bearish target to follow as a result of the triple top chart pattern, we consider the interaction point of the purple trend and the triple top target as a logical outcome for the Bitcoin price. Therefore, an eventual decrease of the BTC/USD could send the price to $390.53 around the middle of January.
Lets now see the bigger picture.
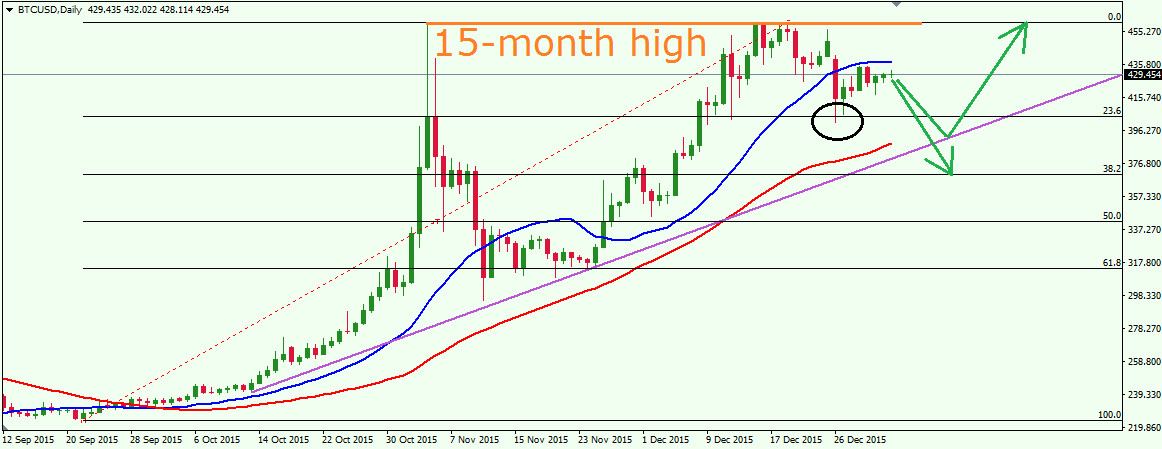
D1 Bitcoin Price Analysis
This is the daily chart of the BTC/USD. As you see we have included two moving averages into our chart, 20 SMA (blue) and 50 SMA (red). First, we start with the general distance between these SMAs, which speaks of an overall bullish attitude of the Bitcoin price. After reaching a 15-month high, the BTC/USD breaks its 20 SMA, which means that the price enters a corrective phase. Since the red 50 SMA is still below the current price, we cannot confirm a price reversal yet. Thus, we still believe that the bulls are the stronger force in the Bitcoin market. Nevertheless, since the 50 SMA moves closer to the purple bullish trend, an eventual decrease of the price might add up the 50 SMA to the potential support area created by the purple bullish trend and the $390.53 target level of the triple top chart formation.
What about Fibonacci? After breaking 20 SMA, the price retraced from a 23.6% Fibonacci level, which is shown in the black circle. This means, that the market forces tend to conform to psychological levels. Thus, eventual price decrease might pull the price either to 23.6% again, or to 38.2%. Note that an eventual approach of the 38.2% Fibonacci level would mean that the price is breaking the purple bullish trend, which will make us approach a reversal scenario.
W1 Bitcoin Price Analysis
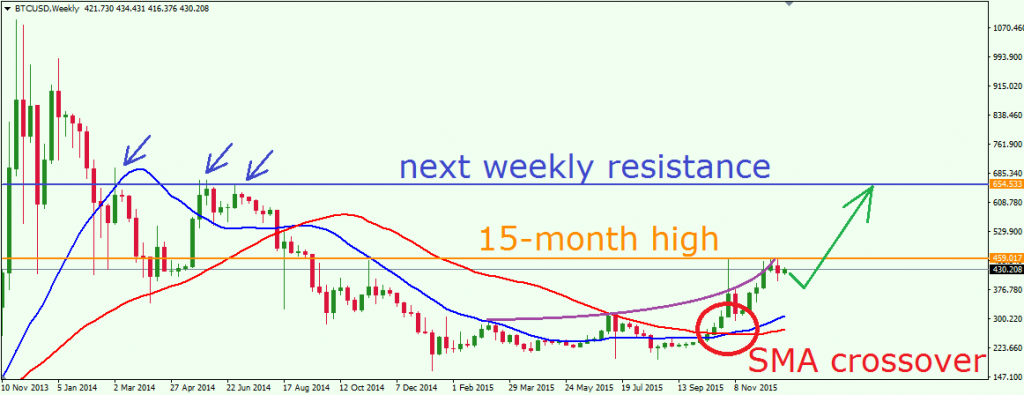
The weekly chart of the BTC/USD speaks of even stronger bullish idea. Notice the direction of the last four tops of the price. As you see, the movement of the tops is definitely bullish and also it is exponential. This confirms that the next top is likely to be higher. Furthermore, the top could be exponentially higher, which infers a rapid increase of the price.
Notice our 20 SMA and 50 SMA. The two simple moving averages have just confirmed a bullish crossover, which implies that an emerging bullish trend is just in its beginning. Nevertheless, since the price has not broken its $459.00 resistance, we cannot confirm the overall bullish idea yet. If the $459.00 level gets broken in a bullish direction, the next weekly resistance of its rank will be the blue $654.5 level, which is almost $200.00 away from the current price. If you wonder where this level has come from, have a look at the image above again and you will notice the three blue arrows, which point out the tops creating the $654.5 resistance. Thus, we consider this resistance as the logical bullish target of the BTC/USD in case of a new high.
MN Bitcoin Price Analysis
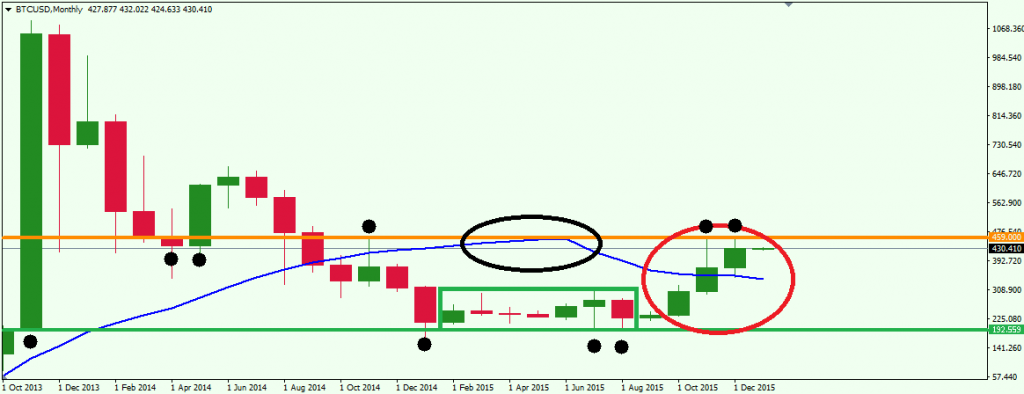
The monthly chart of the BTC/USD shows us the strength of the recent bullish activity. As you see, the last three monthly candles in the red circle are bullish, which creates a large chance that the next one will be bullish too. Also, on the MN chart the 20 SMA is broken in a bullish direction too.
The interesting thing here is the $459.00 resistance, which marks the 15-month high. Notice the origin of the level. As you see, in addition to the three tops on this level, we have two bottoms from April and May, 2014, which are in the area of that level. This means that $459.00 has been acting as a support in the past. Furthermore, our 20 SMA has a top exactly on $459.00, which puts additional emphasis on the reliability of this level. Therefore, we believe that an eventual price move through $459.00 would confirm a strong long term bullish activity for the Bitcoin price.
Conclusion
- Although Bitcoin price was consolidating during the most part of 2015, we notice persuasive bullish activity during the last three months.
- The triple top on the H4 chart creates a clear correction target for the BTC/USD – $390.00 at around the middle of January.
- The 20 SMA is broken in a bearish direction on the D1 chart, confirming the correction to the target. 50 SMA is still below the price, which excludes eventual reversal for now.
- 23.6% is a crucial Fibonacci level for the price.
- D1 chart shows the fresh 20 and 50 SMAs crossover, which confirms an emerging bullish trend.
- The last four tops on the D1 chart are closing higher in an exponential way, confirming the bullish strength.
- Monthly chart shows three clear bullish candles, which break 20 SMA.
- The 459.00 resistance is crucial for the Bitcoin price movement. If it gets broken, a new long term bullish activity might be on its way.