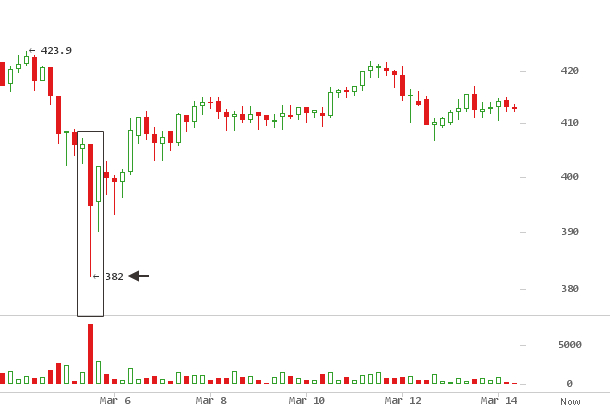
This week, the bitcoin price retraced back up above the $400 level,
from its $382 low on March 5, 2016. This low was the result of a sharp
sell off from $423, last week’s bearish price action. This week’s price
action has been limited to a $10 trading range, with $420 as upper and
$410 as lower bound limits.
It is clear on the above chart, $420 is a significant resistance
ceiling. It is also telling from last week’s action, a range between
$423 and $416, where it held as strong support for 40 hours before
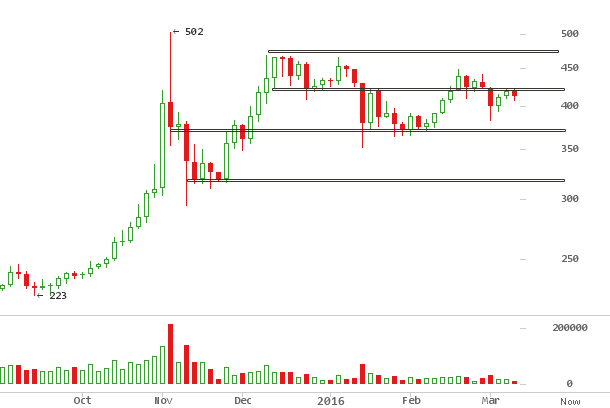
succumbing to sell pressure, down to $382. The 3 day chart below from
Bitstamp highlights keys levels.

As of writing this, buy, sell order trades are settling at $413, right
below the $420 level. It dates back to December 2015, and a failure
here to break above it and turn it into support would result in a retest
of the lower level marked here at $352. Beyond this, key levels are
$450 on the upside and $300 on the lower.

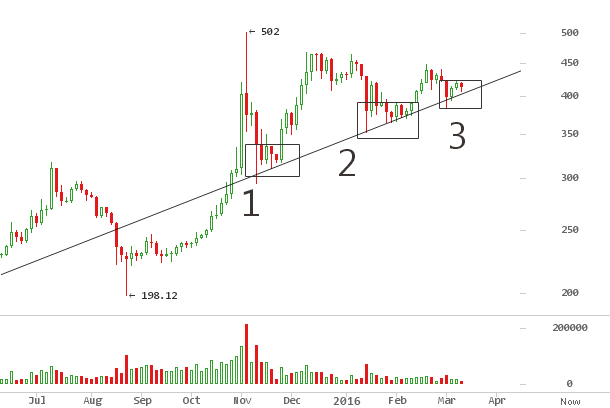
On the above 3 day chart from Bitstamp, a rising slope line dating back
to January 12, 2015 $152 low has been support for retracements down,
with price bouncing off this line at (1), (2) and this week’s (3).
Although not yet complete, (3) exhibits an uncanny resemblance to (1)
and (2). A second attempt lower at (3) is reasonable, just as at $300
and $352.

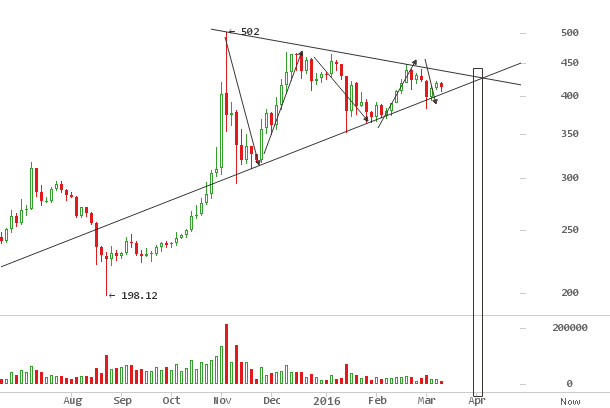
The prospects of a symmetrical triangle with high probability upside
breakout is looking more likely by the day. This 3 day chart above adds
a lower sliding slope line to make a triangle. Since November 2015
$504, price has oscillated within the bounds of both trend lines, with
a likely deadline convergence breakout sometime in April. Ideally, the
market should continue trending within the tightening end of this
triangle and break out to the upside.
On bitcointalk, traders are monitoring it closely:
“Still time for a false break, triggering stops in the process. As long
as the C wave low holds (352.5), triangle is still valid. The 390 hit
was lacking a completed structure, so I am still looking at the
possibility of more down, even if truncated, to complete the triangle.”
There could be a break lower upto $352, that would still maintain a
bullish probable count to $650+.
Coinagogo on
reddit
bitcoin markets is bullish based on an interesting pattern closely
resembling a post bubble technical pattern observed in the Russian
Ruble market since December 2014 to
June 2015 when it broke out to the upside.
“I expect a slow and steady rise beyond $500 from here. The decks are
clear of weak hands, and as evidenced by the lower and lower knee jerk
declines, the strong hands have been accumulating.”
There is however, an alternative bearish case, though, with a far lower
probability. Tzupy on bitcointalk suggests a break below $400 might
quickly turn bearish
“The big triangle held at 390$, but time is running out for the bulls,
so this time if 400$ will be broken, it should clearly break the
triangle down and cause a massive selloff.”
Japanese Corporations prototype settlements on Bitcoin Blockchain
On March 8, 2016, via a jointly released
announcement,
Fujitsu Limited, Fujitsu Laboratories Ltd, and Mizuho Bank Ltd revealed
success in trialing a cross border securities settlement system. By
using Bitcoin, final settlement was cut down from 3 days, was low cost
and minimized risk in price fluctuations. Mizuho bank Ltd, also a member
of R3CEV private blockchain consortium, provided expertise during the
trial period that ran from December 2015 to February 2016. Fujitsu on
its press
release
said
“Using the blockchain Open Assets Protocol, the three companies built a
blockchain-forming system in Fujitsu’s cloud environment, recording the
information from a confirmation (matched trade information: securities
name, quantity of securities, currency code, amount, country of
settlement, settlement type, settlement date) as one linked block.”
Ethereum crosses $ 1 billion market capitalization
Ethereum ETH cryptocurrency became the second blockchain asset to cross
a billion dollar market cap, alongside Bitcoin. Since january 16,2016,
the past 100 days, ETH price has gone up 10 times, and is now trading
over half of BTC’s volumes. As at writing this, ETH is priced at
$13.17, at a market cap of $ 1,023,800,217.
While Bitcoin is undergoing a block size increase debate, attention,
trader speculation and money flow has seemingly shifted to ETH.
On March 12, Honk Kong based bitcoin exchange Bitfinex,
announced it
will support Ether trading on its platform as from March 14th, with
plans to add shorting and margin trading features.
Central Bank RSCoin set to Rival Bitcoin
The Bank of England in conjunction with computer scientists from the
University College of London have come up with a proto currency design
for peer to peer transactions. Unlike Bitcoin, fundamentally designed to
be censorship resistance, RSCoin is a tool of state control and confers
monetary policy powers back to Central banks.
According to the
Telegraph,
“University College drafted the plan after being encouraged by the Bank
of England last year to come up with a radical design for a secure
digital currency.”
The success of this state controlled digital currency takes nothing away
from the value proposition of Bitcoin. Ultimately, Bitcoin derives its
value from its permissionless blockchain, censorship resistant and
artificially scarce digital asset.
Bitcoin Weekly Price Forecast
This week Bitcoin looks neutral to bearish in the short term. A second
attempt at breaking $420 and holding above it is in the offing,
possibly up to $426, but it should head back down after, as a
confirmation of $382 as the final low is necessary. As with both
rebounds off the rising trendline marked by (1) and (2) on the chart a
above, a double bottom is a solid foundation for any bullish take off.
Therefore, $390 – $400 will likely be retested.
Longer term, over the next 2 months, a bullish forecast is still in
force with target of $500 and thereafter $650. With the halving around
the corner, this convergence of events makes for an interesting outcome.