The overall Bitcoin price move during the 4th week of the new 2016 is
definitely bearish.
After reaching $405.97 during the last hours of the 3rd week, the price
started the new week with a stronger decrease during decent trading
volumes.
Week 4 Bitcoin Price Behavior
===
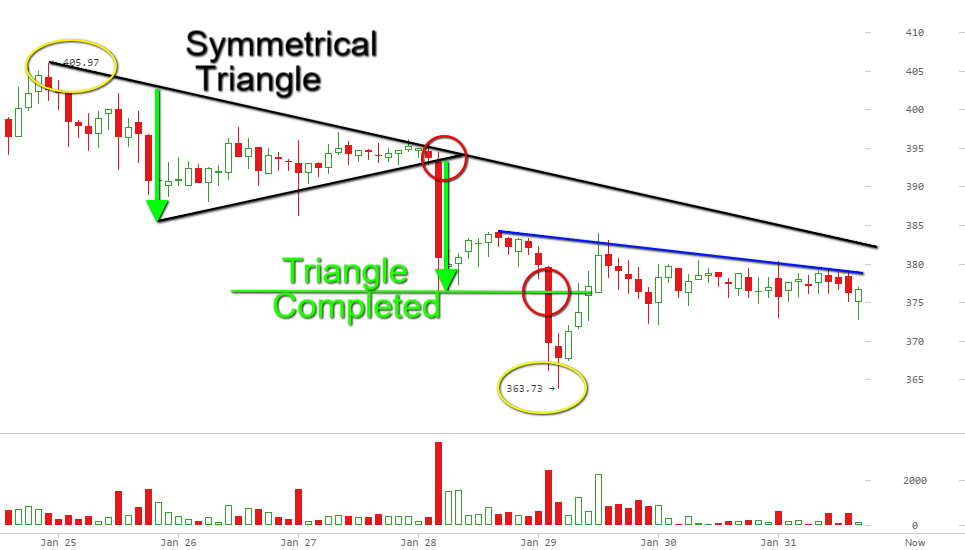
This is the H2 chart of the BTC/USD pair, which embraces the whole last
week (Jan 25th – 31st, 2016). The long black bearish line indicates the
bearish attitude of Bitcoin during the week. The bullish black line
marks the bottoms from Jan 26th to Jan 28th. As you see, the two black
lines form a symmetrical triangle, which got broken in the morning of
Jan 28th. A big decrease to $375 appeared as a result of the bearish
breakout in the triangle. This downward move completed the bearish
potential of the figure. After one day of correcting, the price spiked
down through the $375 support, creating the weekly low at $363.73.
The next four candles head the price back to the $375 – $380 area. The
subsequent price behavior has consolidative character. Bitcoin is
currently moving sideways, where a new interaction with the black
bearish trend line might occur.
In general, the price move during the last trading week shows us that
Bitcoin has no intentions to cancel its downward move.
Let’s now switch to the bigger view of the Bitcoin chart.
H4 BTC/USD Chart
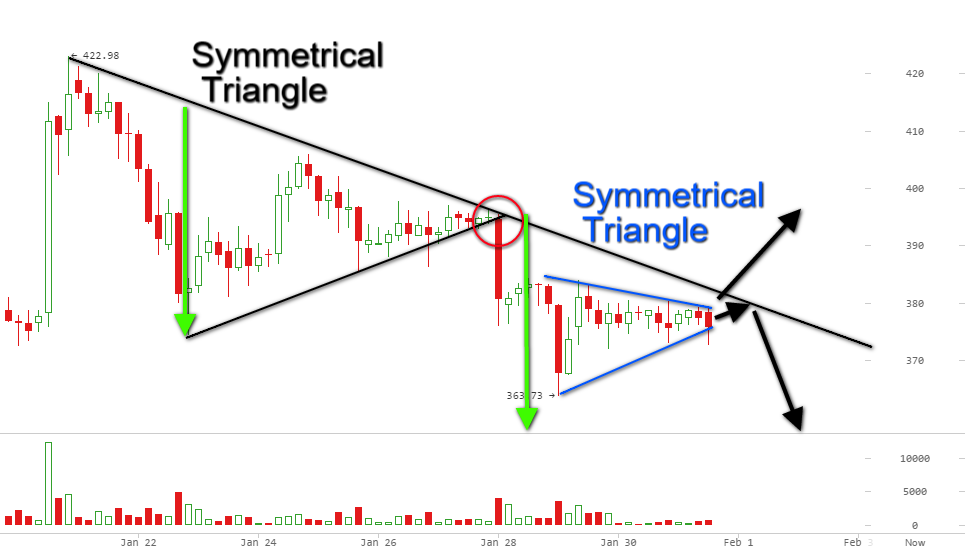
This is the H4 chart of BTC/USD, which
covers the period Jan 21th – Jan 31st, 2016. As you can see, the black
symmetrical triangle we discussed is even bigger. The bearish breakout
through the lower level of the triangle implies that the Bitcoin price
has a bigger formation to complete. However, the weekly $363.73 low is
not a sufficient target for the black symmetrical triangle. The price
needs to drop at least with $6.00 more below the $363.73 low in order
to satisfy the target of the triangle.
On the H4 chart the consolidation after the decrease looks like another
symmetrical triangle, which we have marked with blue lines on the image
above. The symmetrical triangle figure has the potential to push the
price toward a bigger move in an unknown direction. This means the
Bitcoin price could break upwards through the bearish trend, or the
price could enter a new trending move in bearish direction. In this
manner, we have two technical reasons to believe that the Bitcoin is
more likely to keep decreasing during the upcoming week.
First, we could say that the Bitcoin is already in the area of its
bearish trend despite it is not touching it yet. Since the price is
currently moving sideways, there is a big chance for another physical
interaction with the bearish trend. The H4 chart shows us that this
trend line is 4 times tested. Thus, we consider it as a reliable
resistance, which can sustain eventual bullish pressure of the price.
Second, as we have already said, the price has to drop below its weekly
low in order to complete the already broken black symmetrical triangle.
This means, if the price does another drop, it will confirm the smaller
blue symmetrical triangle, sending the price toward a new bearish move.
This is the second bearish factor which we take into consideration.
In general, the H4 chart speaks of a continuation of the weekly bearish
tendency.
Let’s now approach the even bigger picture.
H12 BTC/USD Chart
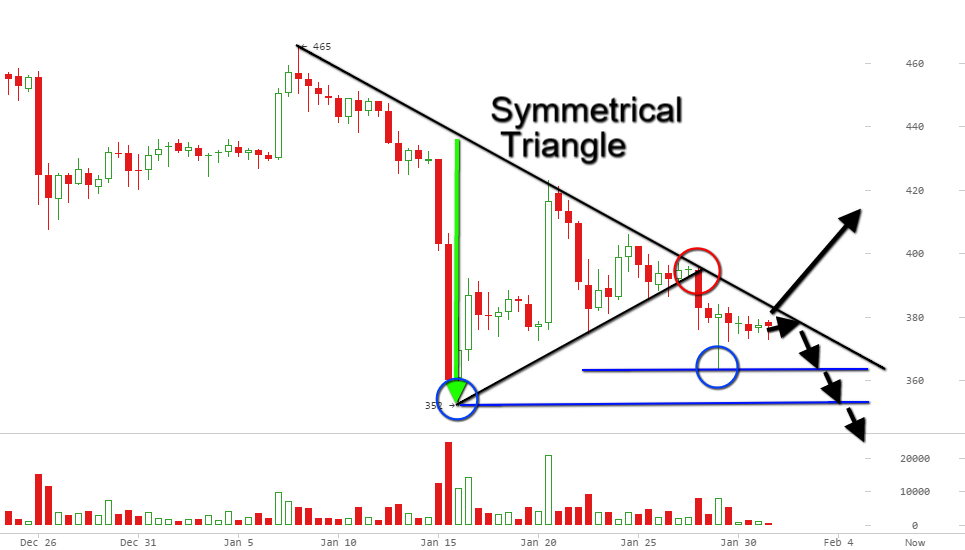
Above you see the H12 the BTC/USD chart, which embraces the period Dec
26, 2015 – Jan 31, 2016. This chart shows us the origin of the general
bearish trend, which we partially investigated on the H2 and the H4
chart. Also, the black bullish line shows us the entire symmetrical
triangle, which we discussed in the other two time frames.
It appears that the Bitcoin price is currently testing its bearish trend
line for seventh time. Since the bearish trend has resisted the price
for six consecutive times, we have a serious reason to believe that
another bearish bounce from this level is likely to occur.
The green arrow shows the size of the symmetrical triangle. After the
price broke the triangle in bearish direction, the overall odds show
that a decrease with the size of the formation might be on its way. If
this happens, the price will have two major supports on its way down.
The first one is the level, which indicates the bottom at $363.73. The
second one is the 2-month low at $352.00. The blue lines and the blue
circles on the image above illustrate where these two supports come
from.
Bitcoin Weekly Price Forecast
As you can see, all three time frames (H2, H4, and H12) support the
bearish idea. Therefore, we consider an eventual bullish break through
the bearish trend as an occurrence, which is less likely to appear.
Since the beginning of 2016, the Bitcoin price has been decreasing with
a consistent pace and our technical analysis concludes that this
attitude will probably keep going. It is a matter of a few candles until
the price touches the black bearish trend again. We assume that this
will push the price toward another bearish movement. If this happens and
the Bitcoin breaks its low at $352.00, the next bigger support will be
in the area of $317.00, which marks few bottoms from the middle of
November, 2015. However, since this level is pretty far from the current
Bitcoin price, we do not see this happening during the upcoming week.
The most logical Bitcoin target for week 5 of 2016 is $352.00 and
eventual break through this level.
Notice that the H12 trading volumes have been pretty low recently. This
means that another volume explosion might currently be on its way. When
the volumes increase again it will be up to the bulls and the bears to
decide the price direction for the following week. For this reason, stay
tuned and prepare for some action!