Bitcoin Price Report
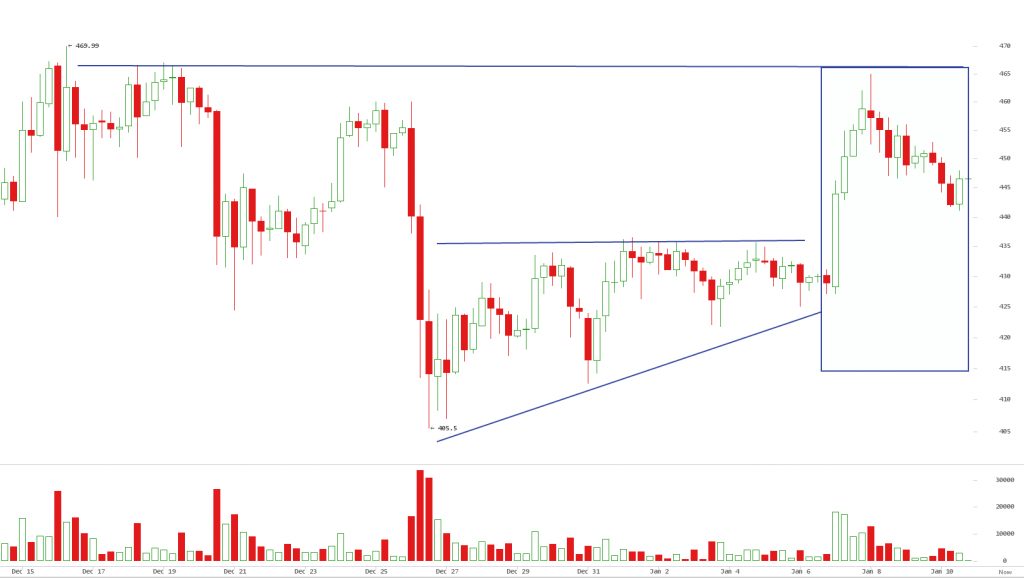
This week, bitcoin broke out upwards sharply, from a low at $428 on
Bitstamp – the apex of a wedge triangle pattern. This step up happened
during early Asian trading hours, 5 am to 10 am GMT + 3 on January 7,
after global markets reacted to fall in Chinese stock market. This sharp
move triggered US and European market lows, with the British market,
opening at its lowest in history.
===
Gold and Bitcoin were the only assets that were up – XBT +6%, XAU +1%.
Bitcoin’s sharp rise topped off at $466, where it met a resistance that
has been tested once before on 3 day charts.
Volumes however, on Bitstamp, were subdued and do not inspire much
confidence on the strength of this leg up. When looked at on a higher
timeframe – 1D daily chart below – bitcoin is trading within a range
defined on December 12. In the grand scheme of things, the magnitude of
this move is typical of this digital asset, just bouncing up to the
upper limit of this defined range – $470 top, $406 bottom.
“Bouncing off of $465 yesterday should serve as a sobering reminder
that we are near the top of the range of $400 – $465. The market could
consolidate here for days to weeks and charge through or continue to
chop in the range for months.” says chewtoy on
reddit.com
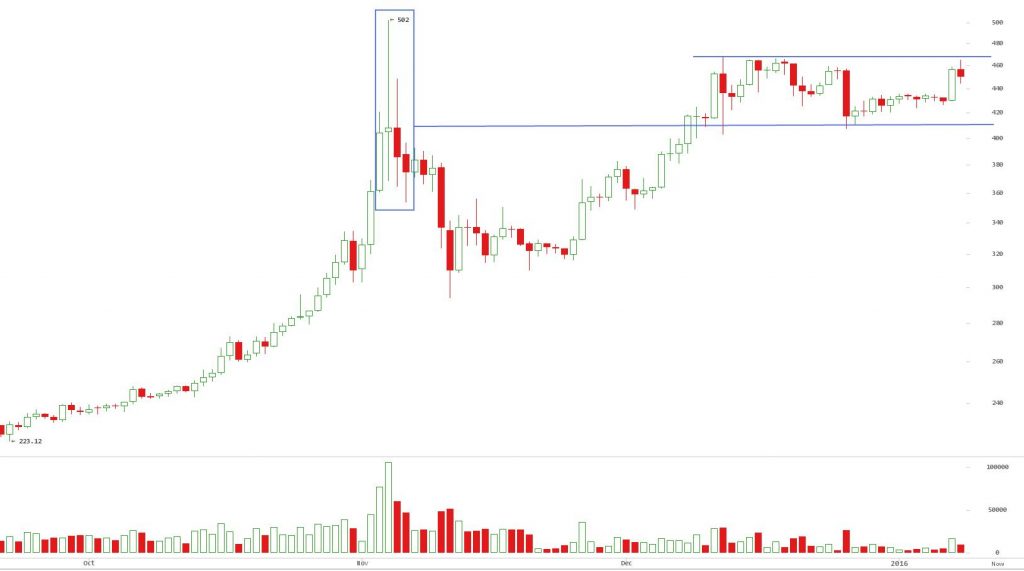
This range coincides with a morning star pattern on the 1 day daily
chart, from November 5th, 2015 when price blew past 1 year highs. The
resulting wick (upper shadow) emphasizes the strong rejection by this
level. Therefore, breaking past this range will be a buy signal.
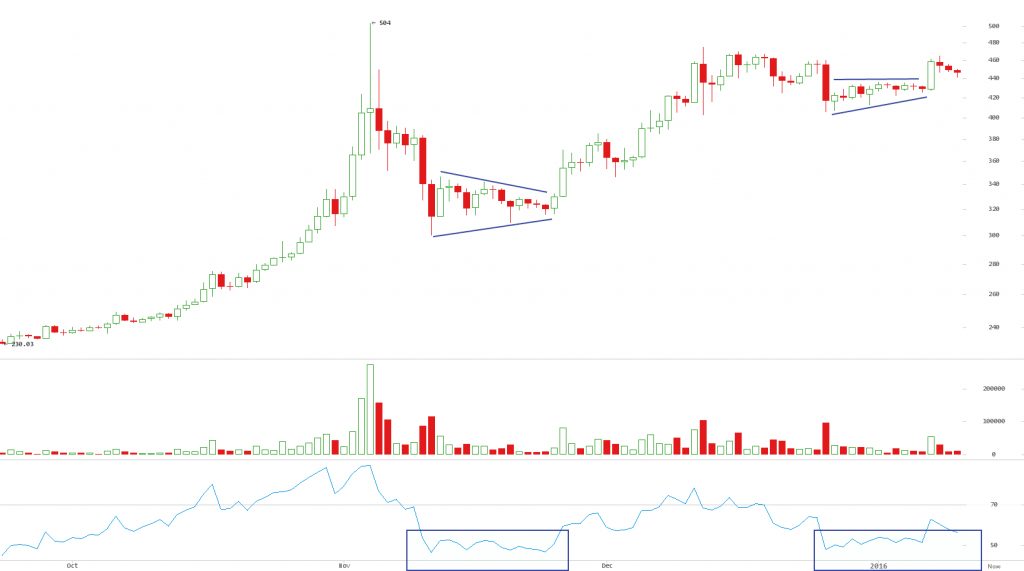
Relative strength momentum indicator (RSI), highlighted in blue
rectangles in the chart above, resembles November’s wedge pattern, below
50 before breaking out with price. Yesterday, RSI moved up above 50
simultaneously with the price. If they continue to move in tandem, we
could see more upside to $500 if a repeat pattern pans out. Generally,
I am cautious of repeat patterns, as it is in the nature of markets to
surprise the majority.
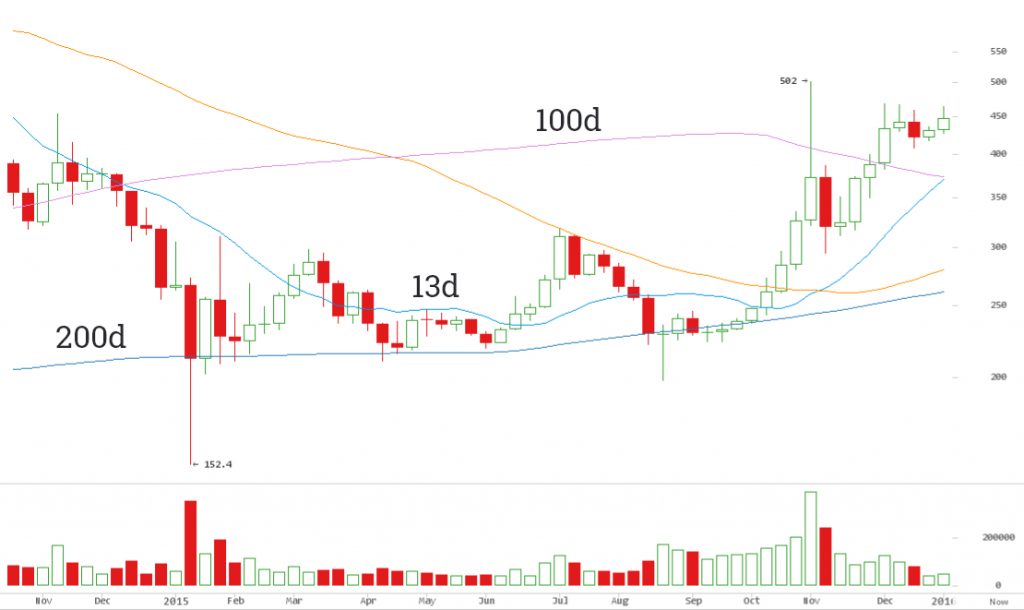
13 day simple moving average on the weekly is about to cut above 100d, a
bullish cross would signal higher price targets – $465+. In November
2014, the bear trend persisted after the 13 day cut below 100d. This is
only the first time the two average lines have come into contact again.
Meanwhile, 200d was a firm support over the course of 2015, rising
gradually together with 50d.
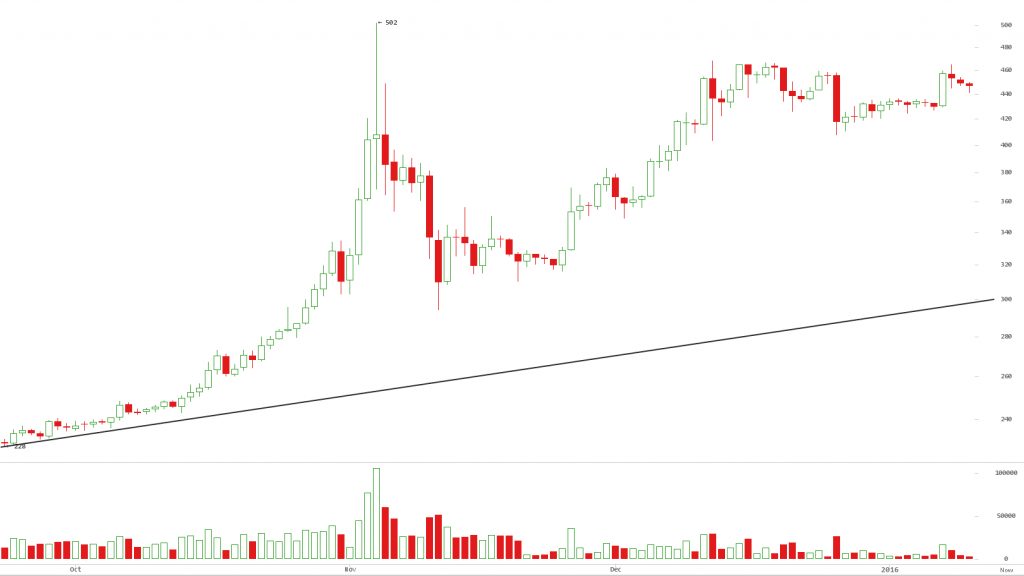
A rising support line from August’s low of $192 cuts across at $300 is
yet to be tested. A failure break above $465 potentially targets a
retest of low $300s – a low probability outcome at this point.
Bitcoin Markets React to Global Market slowdown
China’s capital controls and devaluing Yuan has been in the news,
alongside bitcoin. Markets this week were tumbling according to
Bitcoin Magazine:
“The price of U.S. crude oil declined 5.6 percent. The S&P 500 fell
26.45 points, or 1.3 percent to 1990.26. Nasdaq fell 55.67 points or 1.1
percent to 4,835.76. Britain endured its worst start to trading in 16 years.”
Bitcoin and gold notched higher, adding 6% and 1% in a day. Dips in
global financial markets are yet again reinforcing the virtual
currency’s role as a safe haven choice against fiat assets.
Martin Tillier writes This Time Bitcoin’s Price Increase is both
Logical and Sustainable
for NASDAQ blog, arguing that a large part of bitcoin price movement is
influenced by China:
“the percentage of trades against the Chinese Yuan (CNY) has been
creeping up recently, and stands at 81% for the last 30 days”
Chinese exchanges have been leading bitcoin exchanges over the past 3
months, a well known fact. Due to zero fees structure and opaque
operations, wash trades are high up the list of suspicions. Thus, it is
difficult to distinguish how much trading is real and how much is wash.
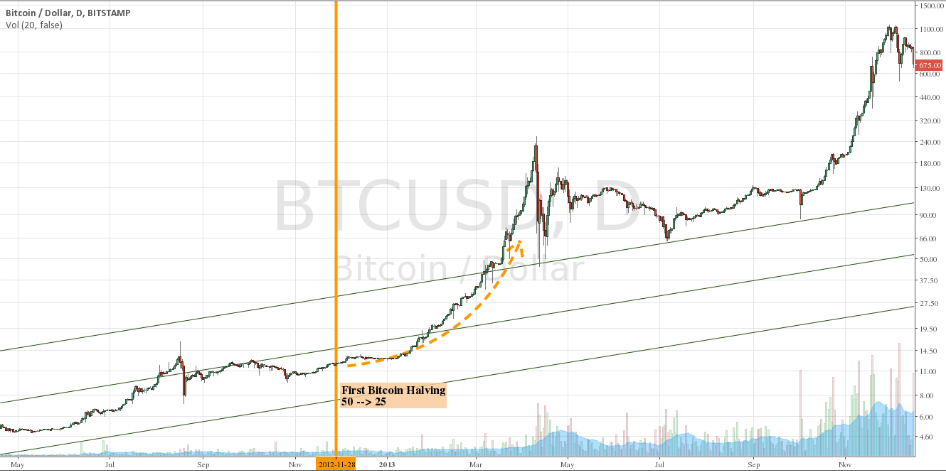
Bitcoin Block Reward Halving draws nearer, drives Bubble Speculation
With the clock on the next halving winding down, speculation on a
possibly new bubble is gaining traction. The market recalls what
happened before and after the last halving. Price went up 6X, 5 months
to the halving, and 10X, 5 months after!
In hindsight, it seems an obvious trade, but there is no telling if the
expected supply rate is fully priced in. The halving may induce a bubble
as part of the price discovery mechanism.
Indeed, if speculators drive a runup in price, this overarching theme
will feed back into market frenzy and build momentum. Sometimes, it is
not really about the fundamental reason, but FOMO triggering the
frenetic side of traders.
BITCOIN PRICE FORECAST
This week, I am cautiously bullish, and waiting for a clear signal to
get in if price breaks above $480. Because price is trading in a range,
a period of sideways trending may persist before a decisive move in
either direction. Therefore, if you do not have an open position, now is
not a good time to get into one.
“Price is in the middle of a range within a range at present, and a
position opened here at around $455 is almost certainly going to be in
profit and in the red multiple times in the short term.” – says chewtoy
on
reddit.com
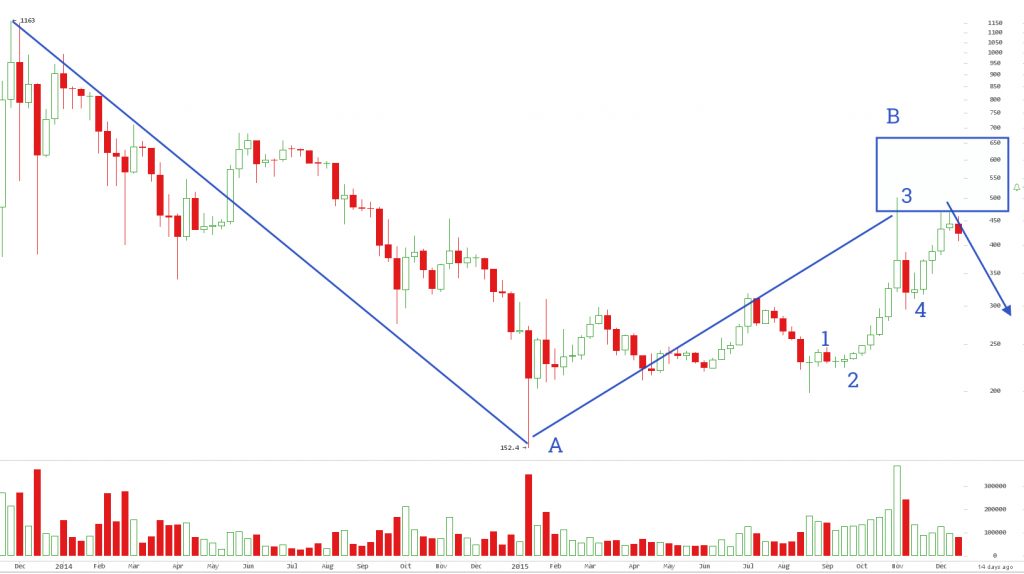
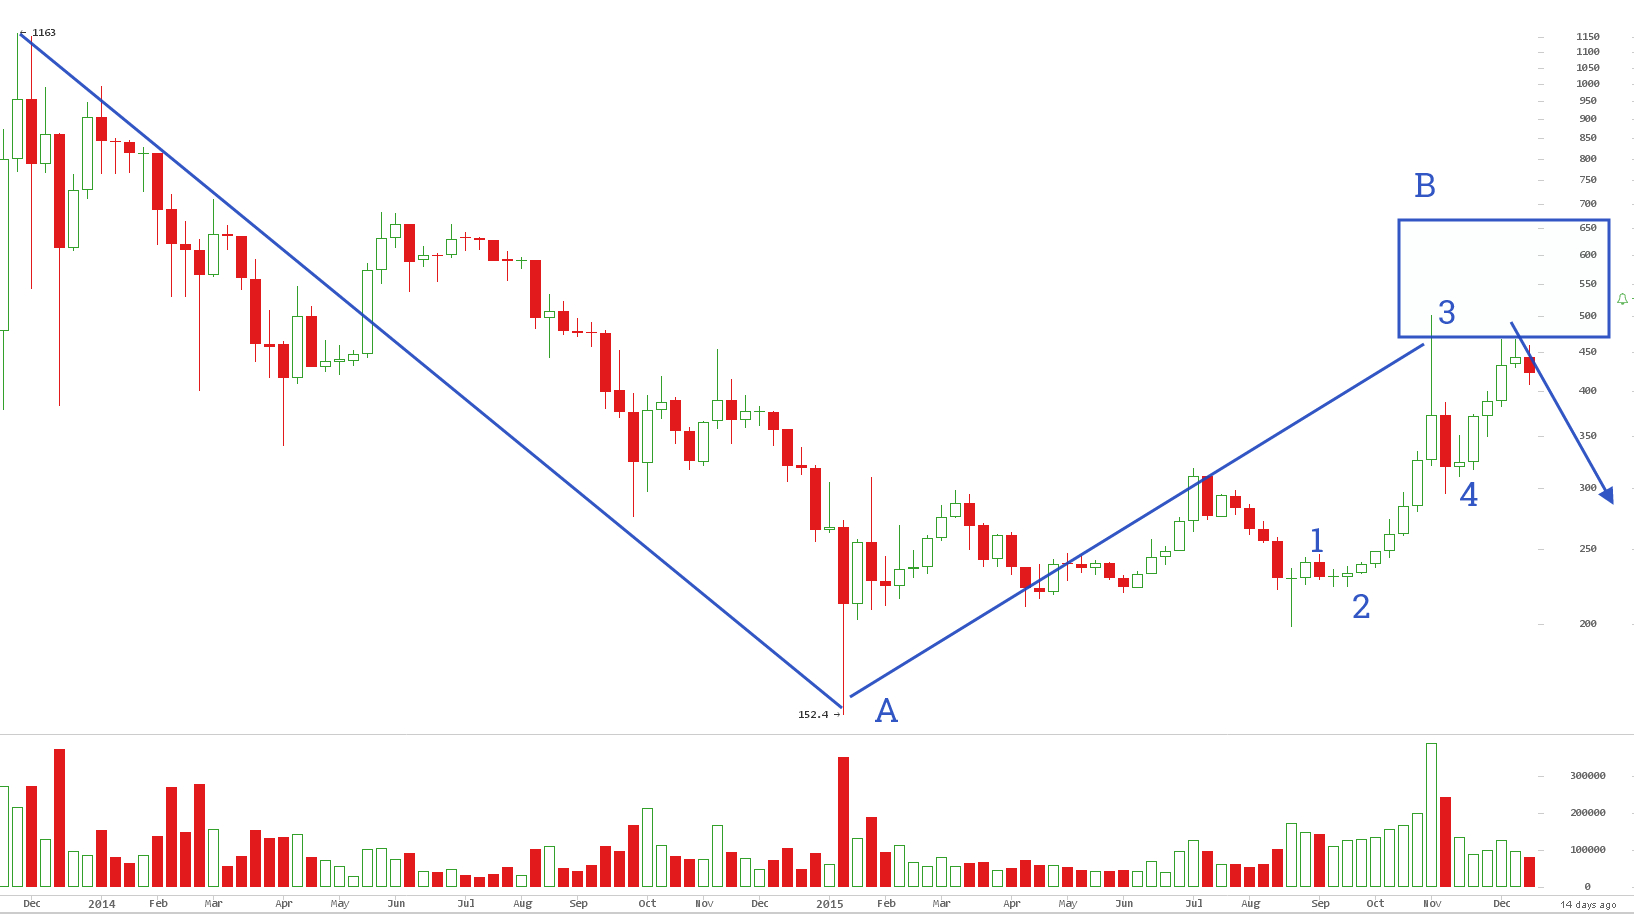
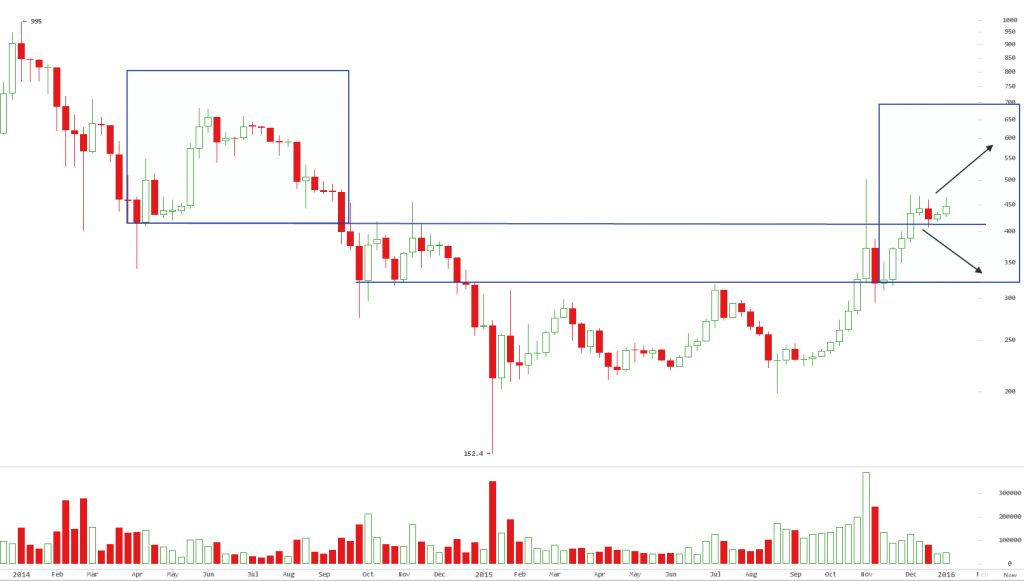
The medium term outlook depends on price action in the coming weeks
within the $400 – $470 trading range. There is still room for more
upside, upto $650 – $700, but, dependent on first breaking the $500
resistance level. A failure to breach $500 on this second attempt will
force price down to the next lower level of support at $300.
Halving speculation, expected on 18 July, could drive up prices up to
$703, a peak level from June 2014. Elliott wave chartists, have counted
4 of 5 waves up and the last 5th wave is unfolding now. It is not
uncommon for it to fail and form a short end, therefore $500+ prices
are not a foregone conclusion. What is important is to observe price
action here for further upside within the blue box highlighted.