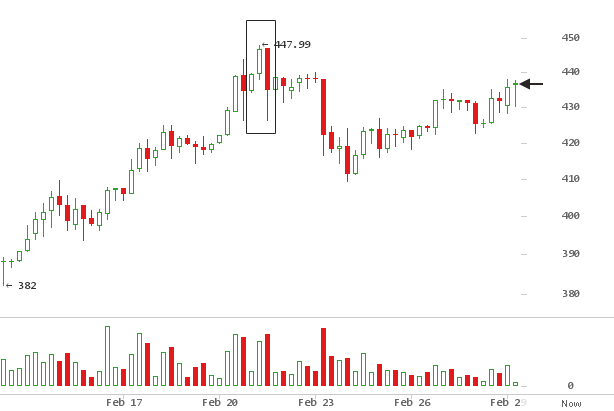
This week the price of bitcoin retraced from last week’s temporary high
at $451, moving down to a low $410 on February 23. As of writing this,
the market sits at $438, a local top dating back to $410. Price has
been gradually creeping up an upward sloping trend line, attempting to
retrace the $40 drop from $450 to $410.
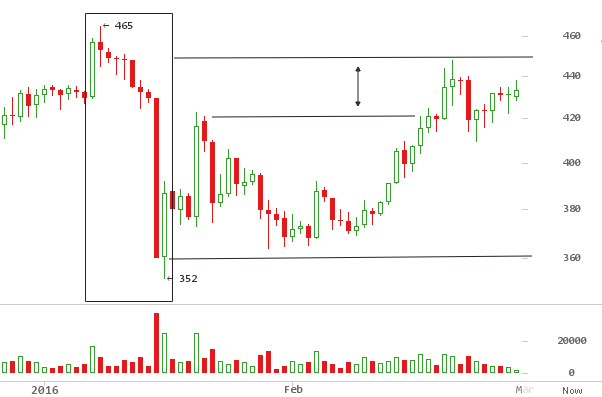
Looking at this chart above, $465 was the highest top in 2016. Since
then, price has failed to break up above this level, an upper wall
resistance. On January 8, price fell off the edge to a low $352, before
trending sideways holding $360 as a steady support. The market is
attempting to creep up to retest this wall again. February 21st $450
top was the first attempt.
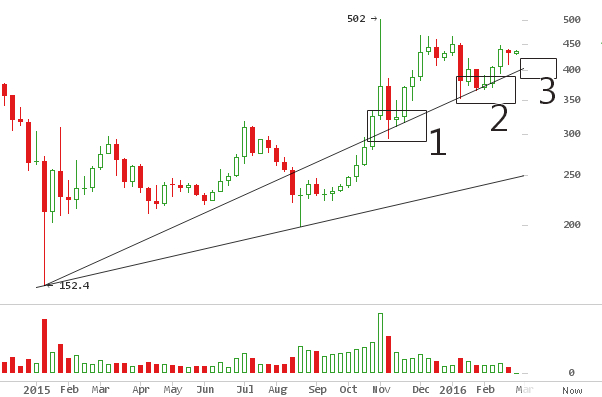
It is natural for price to move up in a series of higher lows while
pushing up resistance levels going up. As seen above, a series of higher
and higher lows, $300 at (1) and $352 at (2). This is ideally bullish
for price. Another higher low on this trendline should hold at least
$385 at (3), for a bullish case to remain active.
This chart above shows the move up from January 12, 2015 at $152, to
the $502 top in November 2015. Fibonacci retracements on this peak to
peak move shows price is trading within a range between $369 and $420.
Over the last 2 weeks, it has slightly pierced above 23.6% fib level. It
does not look convincing yet, so a retracement to below $420 to find a
solid bottom for a second launch is reasonable. A double or triple
bottom retracement akin to the chart below.
Double bottom and triple bottoms at significant fibonacci levels are
common.
On the 3 day chart above, a larger triangle in force since November last
year, is taking shape as expected, within the bounds of a rising and
declining slope lines. A peak at (d) should ideally be followed by a low
(e), bouncing off the rising trend line. For this low $400 is the
target. This triangle is valid to the C wave low ($352.50 but no less).
It would not be unusual for a failure to hit the lower trendline and
slightly break it to trip the stops that are based on this triangle.
However, if the market strongly breaks the $380 level, bitcoin will
likely resume the downtrend straight away.
The next 2 weeks are therefore crucial for a huge move in either
direction. Market watchers are split on forecasts on either direction,
but there is a heavy bias on a bullish breakout.
Paul Sproge on
twitter is
bearish:
“$440-450 is my upper limit. Beyond that and I will be long term
bullish on bitcoin… I am still bearish for the majority of 2016”
adamstgBit on a
thread on
bitcointalk is bullish:
“The market reacted very well to the [The Bitcoin Roundtable
Consensus] news, and we are seeing very strong support at this new
440$ level. I firmly believe this news will catapult bitcoin to 750. A
correction is underway, i’m thinking we will keep pushing new highs day
in day out for weeks if not months.”
Hedge Fund Manager Mark Hart Long Bitcoin
Back in 2006-2007, Mark Hart was one of the few financial market
experts warning of an impending subprime crisis. Also a Chinese expert,
his insight on an looming Chinese devaluation before it happened was
uncanny. While speaking to Real Vision
TV, he revealed he was
buying bitcoin, citing Yuan devaluation as potentially propping the
virtual currency according to an article on
Zerohedge.
“Bitcoin is interesting to me as a route for capital flight. I am not
opining on the long-term viability of bitcoin – I do think there is
something there – I am long bitcoin specifically to capture capital
flight from China.”
Charlie Morris tips Bitcoin for $697 on Tip TV Finance
Bitcoin is increasingly becoming a commodity of interest in mainstream
trading circles. Zak Mir, Bill Hubard and Charlie Morris, discussed
bitcoin and an impending break out to the upside, citing targets of up
to $697 on Tip TV’s Finance show episode Gold on top of the commodity
market, Bitcoin continuing to
697.
Charlie went on to label any correlation between Gold and Bitcoin and
spurious at best, but admitted he was bullish on bitcoin more than gold.
Bitcoin is now quoted on mainstream trading platforms, which now makes
it a reality, bridging the gap closer to the public.
Meanwhile, Raoul Paul, an ex-Goldman Sachs hedge fund manager and now,
founder of Global Macro Investor and Real Vision Television,
tipped
bitcoin for a high probability break out of a 4 month wedge.
Satoshi Roundtable Blockchain Retreat Kicks off in North America
A small group of influential leaders in the blockchain industry,
convened this week on February 27. The attendee list which was limited
to 75 invite only participants, included developers, CEOs, investors and
early adopters.
The Bitcoin protocol, an absolutely fundamental piece of the price of
bitcoin, has caused a rift within the community as different factions
disagree on a roadmap to scaling and decentralized bitcoin. Satoshi
Roundtable, is an attempt to arrive at
an agreeable path forward.
Bitcoin weekly Price Forecast
This week bitcoin is bearish in the immediate short term, with targets
for a low rebound at $400, and an allowance to $385. A rebound off
this level should fall within the structure of the triangle highlighted
above. Thereafter, a gradual rise should follow.
Bitcoin is bullish for the next 2 months. A bounce from a low of the
triangle will be a solid launch for breaking $466, and high probability
target at $650. A large portion of bitcoin market watchers are
monitoring this triangle structure unfold, so a positive signal for a
breakup will drive up price wildly. Every trader will go long on the
trade and reinforce bullish sentiment. In such a scenario, $800 is well
within reach.