The past 2 weeks of bitcoin, markets have been in a choppy sideways
action within a range with $422 and $363 as the upper and lower
limits. When price touched a low $352 bottom on January 16, 8am UTC, it
marked the lower bound of a range that has persisted for 3 weeks. A
strong retracement to $422 set a marker for the upper range.
===
These past 2 weeks have been uneventful, a series of give and take
between longs and shorts. The low of $363 on January 30th, 10pm UTC,
was quickly followed by successive rejections of this bottom. This
preceded a sudden spike to $392 on February 4th, 8pm UTC.
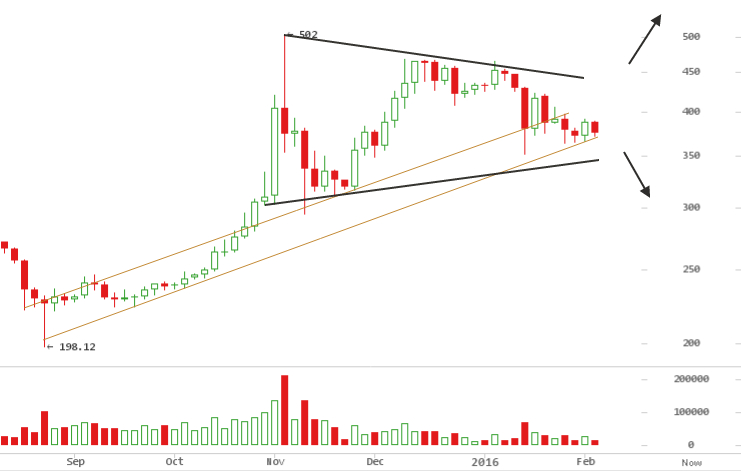
The current short term state of the market is indicative of the wider
ambivalence on resumption of the bull trend from $198 low of August 24,
2015, or a continued trend down from consecutive failed breaks at $502
and $467.
So far, on the 3 day chart, a symmetrical triangle pattern is seemingly
taking shape, consolidating within two converging trend lines. In
technical analysis literature, this triangle is frequently grouped under
continuation patterns. Patterns that signal a consolidation period
within a trend, followed by a resumption of the prior trend.
As the price approaches the apex, an imminent breakout draws nearer, as
early as the second week of March. In the event of a breakout, an
increase in volume follows the direction of the breakout.
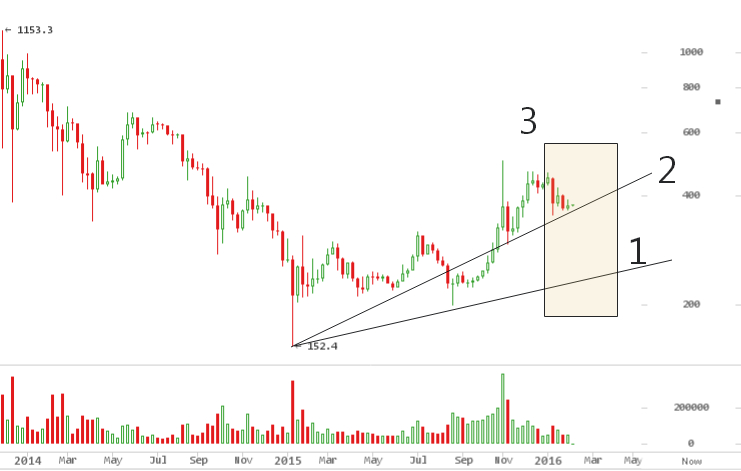
This weekly chart above captures the decisive point of the market (1)
and (2). Trend line (2) from January 12, 2015 $162 low cuts across
$350, the most recent low. If it holds,the trend should creep up the
upward slope. On the other hand, $250 is the next logical level on
failure of $350 support. Here sits another trendline from the $162 low
in January 12th, 2015 and $198 bottom on August 24th, 2015.
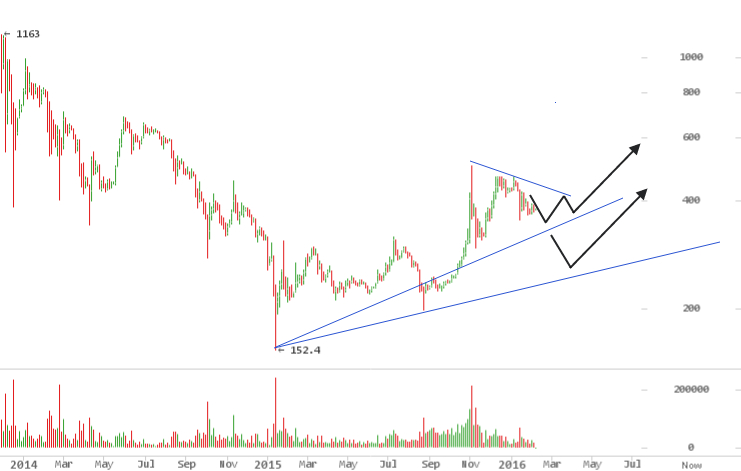
In both scenarios, price would bounce off the trend line and resume an
upward trajectory to $600, just in time for the reward halving with all
the fanfare. The market is expecting halving speculation to stimulate
price into a bubble. $350 and $250 are the price levels to watch.
As seen in this chart above, price sits at 38% Fibonacci level marked by
(3), a retracement from $162 January 12th, 2015 low and 16 month high
at $502 from November 2nd, 2015.
The first time this level was tested was (3) on January 16th, 2016 from
where it bounced off, so another test of this level is due for a double
bottoms, common for asserting levels to launch from. Similar to (1) and
(2) highlighted above.
A double bottom can also fail and lead to capitulation to a lower price
level.
Blockstream secures funding to commercialize Bitcoin blockchain
This week,
Coindesk
reported Blockstream’s $55 million Series A funding round, a vote of
confidence for bitcoin ecosystem and its utility as an open source
permissionless ledger. Over the past year 2015, the hype around private
blockchains has seen banks form consortiums to build out their own
private ledgers, such as R3CEV backed by over forty large cap commercial
banks,
In the long run, increasing the utility of the Bitcoin Blockchain is
bullish for price. For CEO Austin Hill, building bitcoin’s open source
tech is not mutually exclusive to Bitcoin philosophy, because the
codebase can become more relevant for commercial applications.
In the same week, the startup announced through its
blog
a strategic partnership with PWC, saying
“Together, PwC and Blockstream will help companies evaluate
cryptocurrencies and blockchain technologies and launch new uses for the
Bitcoin protocol.”
The success of Bitcoin, and ultimately its price, is dependent on
valuable use cases of the underlying blockchain. It is a crucial
fundamental piece for long term price.
Ethereum Up 90% over 2 weeks, $3.00 per Ether
While Bitcoin has been undecided on whether to go up or down, Ether has
crept up over the past weeks since January 24th, 2016, on the back of
great news, R3CEV using Ethereum tech in their recent proof of concept.
ETH has now surpassed Litecoin in market cap on heavy volume, now at
$230,304,325 market capitalization, trading at $3.00 a piece. Already,
comparisons with Bitcoin have surfaced. A
tweet
from George Hallam
“Just 4 months after release, Ethereum already has ~1/4 the number of
nodes on the bitcoin network (1354/5712)”
It comes at an interesting time, when Bitcoin is going through an
apparent crisis. Speculators may use this to fuel BTC dumps and ride ETH
for a while.
380 nodes show Support for Bitcoin Classic
Bitcoin’s seeming crisis stems from a community dispute over conflicting
proposals to raise the block size limit. Bitcoin Classic, a hard fork
proposal to
increase the transaction processing capacity from 1MB to 2MB, is
garnering support with 380 nodes running it so far as per
coin.dance
The risk of a hardfork is systemic, and would send markets into panic
selling, at least until the dust settles.
Bitcoin Weekly Price Forecast
As of writing this, price wobbles around $377. The choppy, indecisive
action from the last 2 weeks is set to continue. This chart illustrates
expected range bound action between $365 and $390 until a break out.
As outlined earlier, the larger trend here dictates short term price
limits, as its eventual outcome bids time.
Price has broken below the 50 day and 100 day exponential moving average
(EMA) lines on all timeframes: 1 hour, 4 hour, 6 hour, 12 hour and 1 day
charts. This chart above shows one exception, the 3 day chart, after
bouncing off the 100 day EMA line as support. Price is not out of the
woods yet, the other exception as the weekly chart shows below.
Both the 50 day and 100 day EMA have been crucial in defining direction
of price while acting as support and resistance at (1), (2), (3) and now
approaching (4). Above is the weekly chart showing expected bounce off
trendlines at (4). Together, they cut across $327.
$327 is therefore a reasonable target for on a breakdown of $353
support. Smart traders could easily take advantage of this level and
push it lower to shake out weak hands. Often, levels are breached
sharply in cascading selloffs, only to resume above or below rejection
levels and leaving behind long wicks. The $504 high in November 2nd, 2015
is a perfect example. Whilst the high was $504, the true level was
$463.
An allowance from $327 to $300 is wise.