Since last week’s price report, bitcoin went up 12% to $448, but is now
trading at $435 on Bitstamp as of writing this. A correction from the
top was only natural at this level.
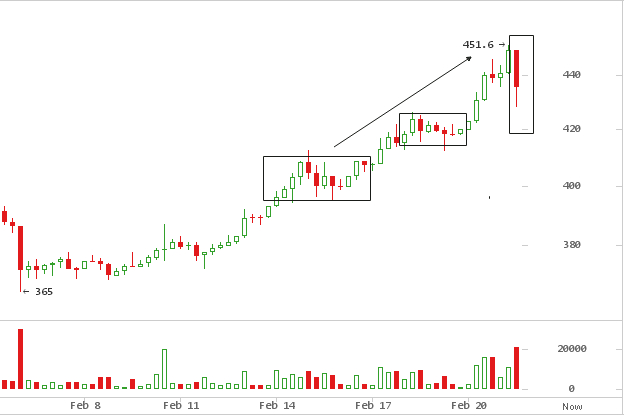
At $400, consolidation lasted a couple of days, before breaking out on
February 17, and taking off to the next significant resistance level at
$420. Similarly, here, the trend was intent on recapturing highs, and
did not take long consolidating before breaking past the January 18
spike resistance in a series of consecutive green candles.
===
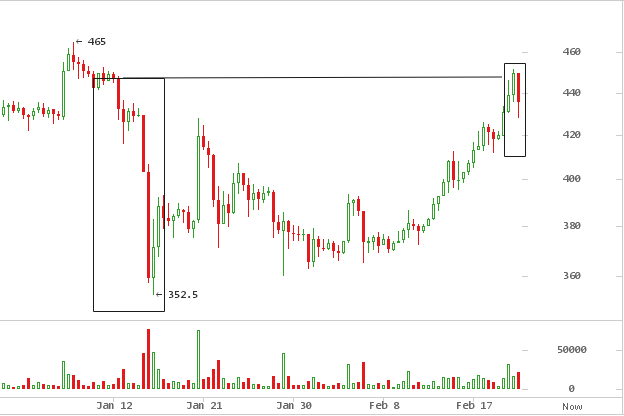
On the 12 hour chart seen above, bitcoin has retraced 100% to the edge
of a cliff from January 12, when price fell off sharply to a $352 low
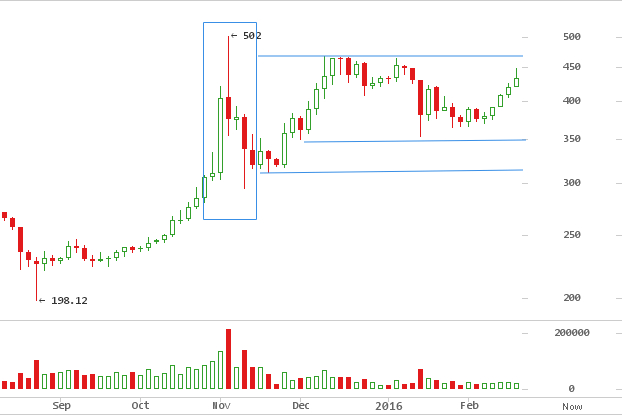
and ignited fears of a renewed bear trend. So now, $466 is the level to
beat; a strong resistance level that has pushed back on upward pressure
to recapture $502 highs since November 4th, 2015, seen below on a 3 day
chart. While there is some room for a short leg up attempt at $460, a
consolidation or pullback was expected. This resistance level has
reasserted itself 3 times before in the past 4 months.
This rise up has reinvigorated bullish sentiment. However, $450 would
have to succumb to buying pressure first, before taking on $466.
Traders are on the fence, and have no idea how strong of a defence it
might turn out to be, especially after the sell off from the $450 that
corrected upto a low $425. Others, are decisively pessimistic, viewing
this run up as a typical pump “buy the rumor sell the news” hype, tied
to Bitcoin roundtable consensus announcement.
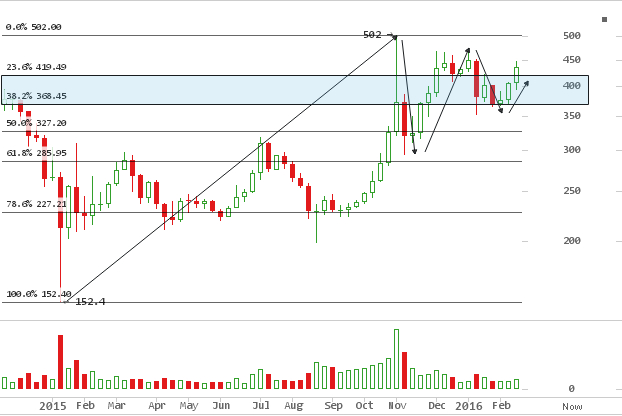
On the weekly chart, price sits high above the $152 low from January
12, 2015. Traders sentiment suggest this was the final bottom, of the
preceding 13 month bear from the $1163 all time high. This would mean
the beginning of a new cycle.
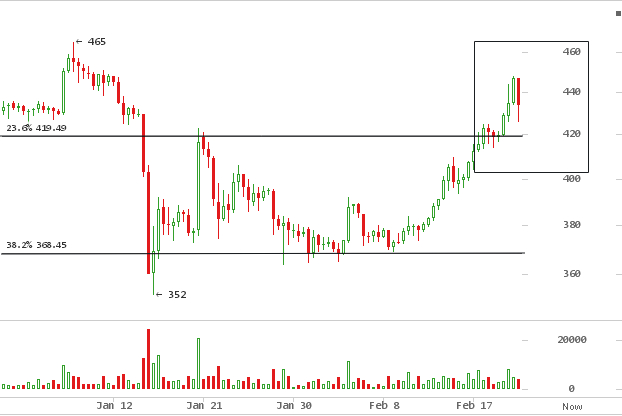
Seen above, fibonacci retracement from this $152 low peak to $502 high
from October 2015, highlights this week’s run up, that broke past 23.6%
resistance level at $430.
Zooming in on the 12 hour chart below, it is not yet definitive, as the
current retracement could head back to retest $420, possibly back into
this zone. Watch $420 for a test of support.
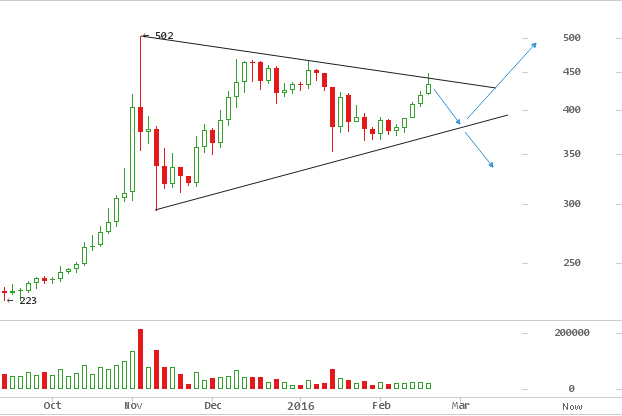
On the 3 day chart, a large 4 month triangle is still in force seen here
below.
A retrace here could go back down to as low as $400 followed by a
bounce off the rising slope, well within bullish territory, according to
slowmoon:
“50% retrace is usually followed by a 100% recovery but it will take
longer than the crash. If that holds true, we should be back in the high
440s in 3-7 days from now.”
A large section of the market agrees the whole $400 will be decisive.
Either, a continuation of the uptrend after retracing to $400, or, if
400$ does not hold in about a week, big dumps may follow. Price hangs
on the balance, a make or break level.
Paul Sproge on
twitter
agrees:
“$440-450 is my upper limit. Beyond that and I will be long term
bullish on bitcoin… I am still bearish for the majority of 2016”
Consensus Path to Scale by Bitcoin Roundtable
The bitcoin debate an agreeable approach to achieve scale, has divided
the community into factions. At the heart of it, a split between soft
and hard fork proposals.
On February 21st, 2016, in Hong Kong’s Cyberport, an 18 hour meeting
took place, attended by representative of influential stakeholders in
the industry: developers, miners, exchanges. They settled on a
reasonable path to have both a soft and hard fork in the next 17 months.
The
roadmap
outlines a timeline as follows,
- Segregated Witness is expected to be released in April 2016.
- The code for the hard-fork will therefore be available by July 2016.
- If there is strong community support, the hard-fork activation will likely happen around July 2017
The state of Bitcoin’s core technology is inextricably linked to its
price, and is a fundamental consideration for investors.
In an answer on
Quora,
Bram Cohen, investor of BitTorrent believes the market is in for a rough
ride as
“fundamental problems remain and are if anything becoming more clearly
fundamental. As a technologist all these problems are fun to work on,
although they’re worrisome if you’re an investor or potential user”
Ether price loses ground, retraces 50% of February 2016 gains
After tapping out at $7.00 ((0.01779 BTC) a piece on February 12th, the
price of Ether sharply corrected in typical bubble fashion, declining
50% off its all time high. As of writing this, it is trading at $4.38
(0.0098 BTC) on Kraken.
So far, 2016 has been a fantastic for Ethereum, rising up the ranks past
Litecoin and Ripple to claim the 2nd most capitalized cryptocurrency at
$338,614,137. Bitcoin’s centralization and block size debate woes seem to have got
speculators to shift their attention.
On its own merit, Ethereum development warrants attention. The amount of
research going into the platform and tools coming out for smart
applications has got developers excited.
Bitcoin Weekly Price Forecast
This week, price action around levels will be crucial.
Going up, $450 and $466 date back to August and May 2014 as support
and resistance levels. Breaking both these levels will require heavy buy
interest to blast through.
On the downside, $420 and $400 are key levels to watch for potential
support for rebounds back up. A failure of $400 distorts the triangle
pattern referenced earlier. For good measure, an allowance till $375, a
support level that stretches back to September – November 2014.