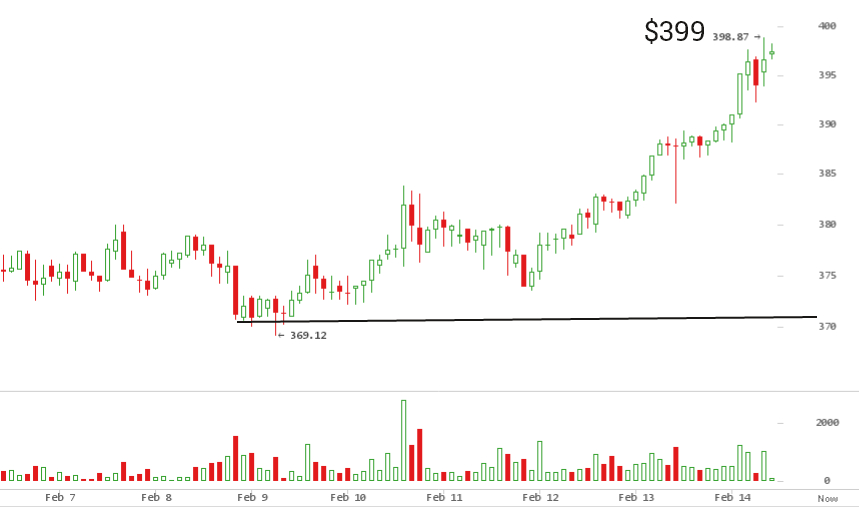
This week on February 9, 2016, price launched off $370 in what looks to
be a reinvigorated attempt at claiming back lost high levels.
Consecutive green candles have broken above $390. It is still too early
definitively say price is off to the races, as $400 and $428 levels
are yet to be broken. As of writing this, price is at $399 and should
break $400 soon. Consolidations before breaking significant levels are
typical. Therefore, shallow retracements or sideways trading ranges at
these levels are reasonable. At times, markets needs to build momentum
before another leg up.
Since last week’s weekly price report, the bitcoin markets have
seemingly found a solid bottom to launch a retrace up to $450 high.
January 8, 2016 was the last time price was above $450, right before a
sequence of cascade selloffs led to a $352 price low on January 15,
2016.
This looked to be the early start of a bear trend, but, in the
weeks that followed, this $352 support has held strong as the lower
limit of a trading range. The upper most limit of this range has been
$428.
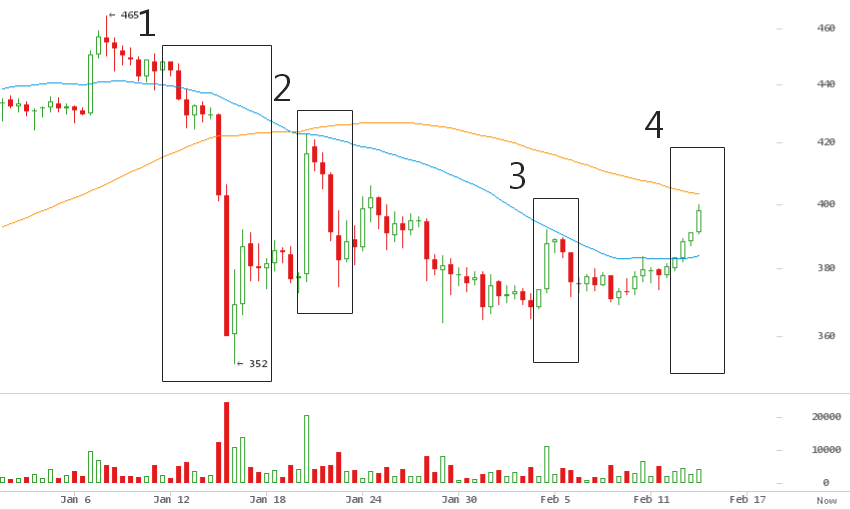
The chart above, shows (1) on January 12, 2016, when cascade sell off
preceded $352 low. Price broke sharply below 50 day and 100 day
exponential moving average (EMA) trend lines. What followed was attempts
by the market to regain momentum for continued trend up from December
2015, (2) and (3) was the market’s attempt at breaking up above periodic
day moving average lines. Both times resulted in rejections, whilst the
lower trading range limit at $365 held.
This week, (4) price successfully broke EMA resistance to go up above 50
day and 100 day trend lines. The green candlestick above the yellow 100
day looks solid so far and should hold steady for another leg up.
Ideally, a complete positive bullish return requires a bullish cross
where, the blue 50 day EMA cuts back above the longer term 100 EMA. In
bull trends, moving average lines align in order of short term lines
above long term lines.
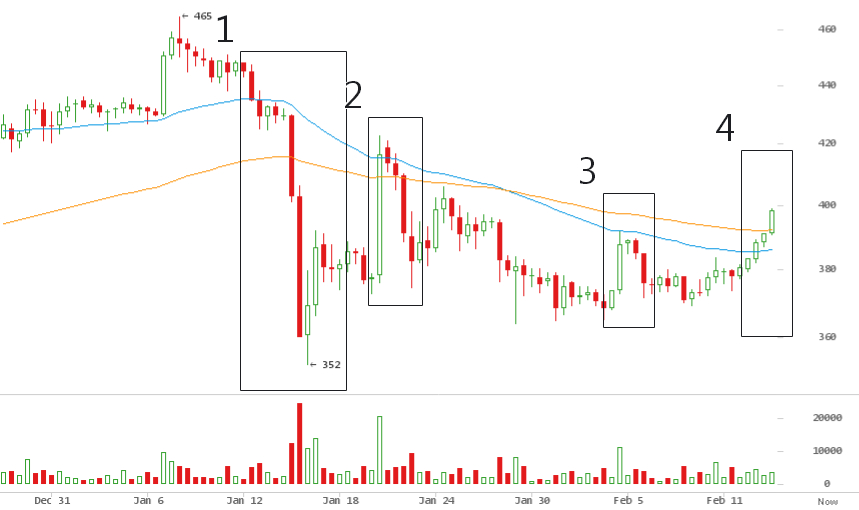
The chart above plots 50 day and 100 day simple moving average (SMA)
lines on the 12 hour chart. Here, just as in the EMAs, price broke below
both average lines at (1). It has been levelling on $365 base support
for 4 weeks, attempting to reverse trend at (2) and (3).
(4) shows price sitting above 100 day SMA, and is now headed for yellow
100 day SMA that cuts at around $404. It is reasonable to expect some
resistance at this level (if any). The real prize however, is a bullish
cross where blue 50 d SMA cuts back above 100 d SMA, reversing the bear
trend at (2) when the short term trend line cut below long term trend
line, a bearish cross.
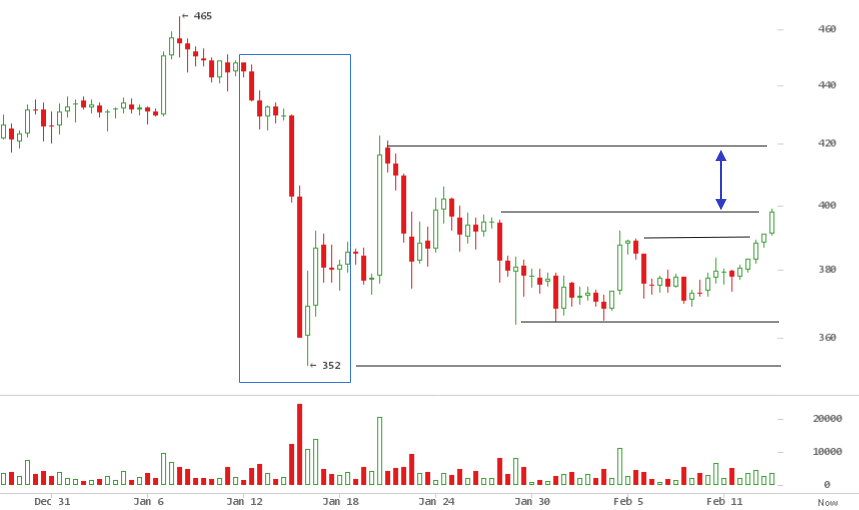
On this chart above, since the January 12, 2015 capitulation low at
$152, and the 14 month peak high at $502 on November 2, the market
retraced to 50% fibonacci level, but spiked down 61.8% fibonacci level
first on November 9, 2016. A second attempt at the high from this level
found resistance at $468 on December 10, 2015, a double top failure
that fell to 38.2% fibonacci level. The highlighted level here lies
between $368.45 (38.2% fib) and $419.49 (23.6% fib).
This chart above zooms in on this zone and paints a better picture of
the next level of resistance at $420, after 38.2% level formed a strong
base, reasserting support multiple times. Expect some resistance at
$420, similar to January 20th.
Bitcoin Block Size Debate takes a turn
This week, a group of influential companies met in a ‘Bitcoin
Roundtable’ to discuss the path forward for raising the controversial
blocksize limit. Arguably the single biggest debate in bitcoin’s short
history, raising the block size has split the community and developers
into factions, all pushing alternative paths to increasing block
capacity.
Despite its official release on Tuesday 9, February 2016. Bitcoin
classic, the latest hard fork proposal out of the starting block, was
rejected by the consortium, who collectively represent 60% of hash power
on the Bitcoin network.
In an open letter published on Bitcoin
Magazine,
the group said
“We think any contentious hard-fork contains additional risks and
potentially may result in two incompatible blockchain versions, if
improperly implemented. To avoid potential losses for all bitcoin users,
we need to minimize the risks. It is our firm belief that a contentious
hard-fork right now would be extremely detrimental to the bitcoin
ecosystem.”
Instead, they backed the proposed roadmap by Bitcoin core, a less risky
soft fork with additional improvements and capacity increase via
Segregated Witness
“We see the need for a modest block size increase in order to move the
Bitcoin project forward, but we would like to do it with minimal risk,
taking the safest and most balanced route possible. Segregated Witness
is almost ready and we support its deployment as a step in scaling.”
Bitcoin’s price is highly dependent on the state aof the network.
Forking is a systemic risk that suppresses the true price of bitcoin.
The recent debates have led to capital outflow to Ethereum.
Ether price shoots up 150% in 5 days
Price shot up from 0.00683 BTC per Ether to 0.01711 BTC per Ether in
under 5 days. Ethereum is now second only to Bitcoin in terms of market
capitalization, now at $423,457,521, trading at $5.50 per Ether.
Over the month of January and February 2016, it has overtaken both
Litecoin and most recently Ripple, as speculators moved to trade the
cryptocurrency while Bitcoin was caught up in its block size woes.
Bitcoin Weekly Price Forecast
This week price should at least go up to $420, where there is an an
evident level to be overcome. The market looks intent on recapturing
higher price levels, after breaking out from a local triangle.
For caution’s sake, a re-evaluation may be necessary once price hits
$420. A larger symmetrical triangle is still in force, and has held
well so far, as seen in the chart above.