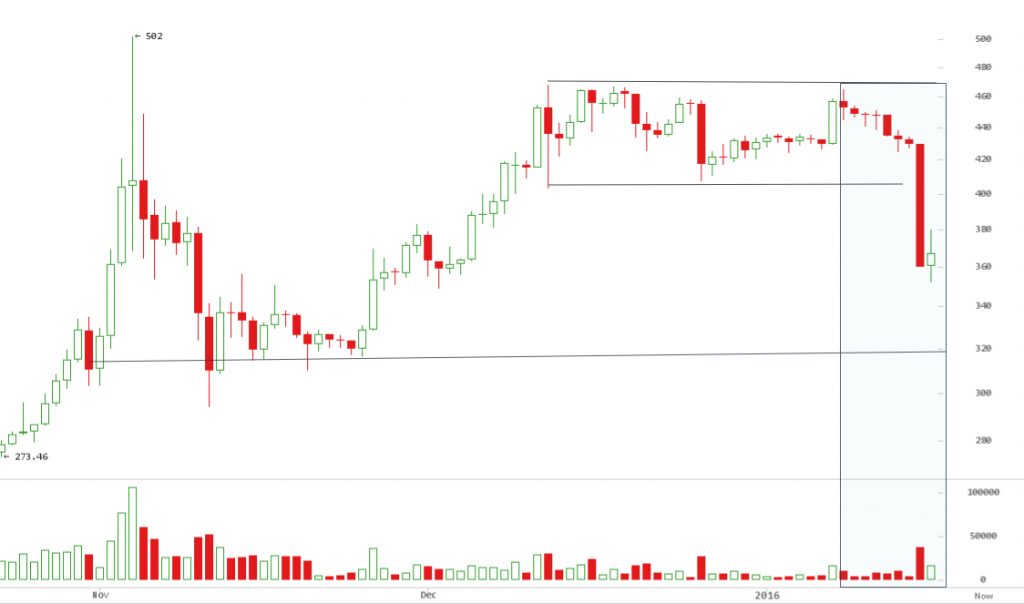
On January 14, 20:00 hours UTC, bitcoin price broke $430 level
support, falling sharply to a $352 low in a series of cascading sell
offs. The chart above, on a 12 hour time frame, shows an impulsive red
candle stopped short at $358, a support level where price has
consolidated.
Bitcoin news outlets and traders are blaming this 18% decline (as of
writing this) since Friday, on controversy surrounding Bitcoin Protocol
soft and hard fork disagreements. While not wholly responsible,
speculators will sell the news if it carries weight.
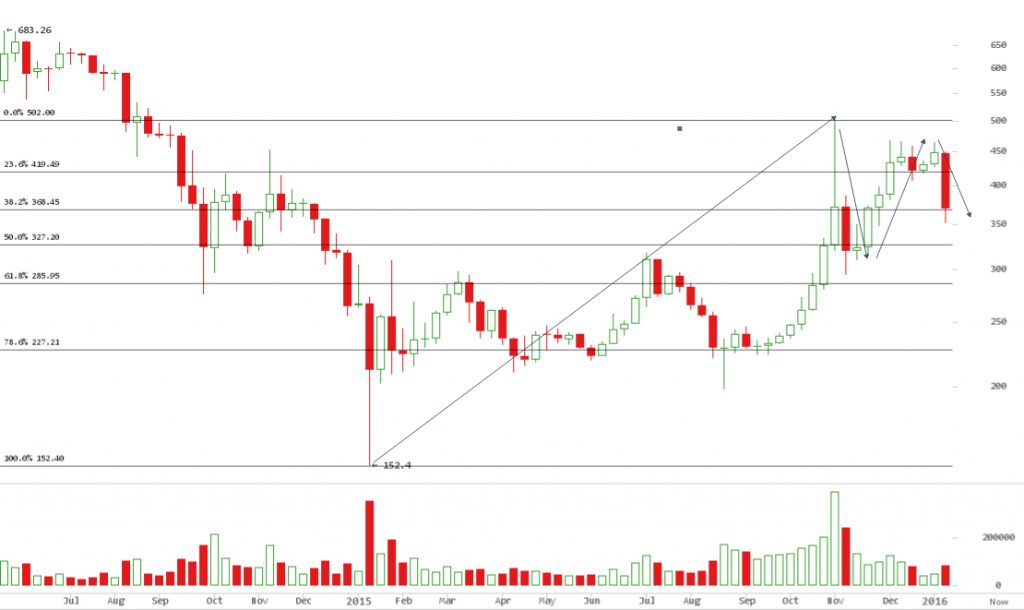
Since exactly one year ago, on January 12th, 2015, the bitcoin price
has retraced 23% of its $162 – $502 year uptrend. After encountering
resistance at $500, retracement found support at $300, but failed to
recapture highs at $473 on a second attempt. This sell off broke below
23% to 38.2% Fibonacci level.
From my experience trading bitcoin since 2011, moves that come after 6
weeks of sideways do not typically end the next day; this level may fail
to hold. BitKrow13 on reddit
suggests:
“there will be support at 2300 Chinese Yuan ($350 USD), if it breaks
below that level, i see a major move down to 2000 Chinese Yuan ($300
USD)”
The chart above is a 3 day chart showing 13 day and 50 day simple moving
averages (MA) over price candles. In April and July 2015, price peaks
attempted to break above MA resistance unsuccessfully. However, a
bullish cross in October, which occurs when long term MA crosses above
short term MA, confirmed a change in trend to the highs of end of 2015.
The most recent bearish turn, fell sharply from 50 day MA. 13 day MA
sits below price fall at $320 – $300. It is a reasonable next target
after a bearish flag pattern forms on consolidation. chewtoy on
reddit
says:
“I think we are going to see bear flag after bear flag all the way down
to $300. If $300 doesn’t hold, it’s going to be a freefall to $250
and then it’s anyone’s guess.”
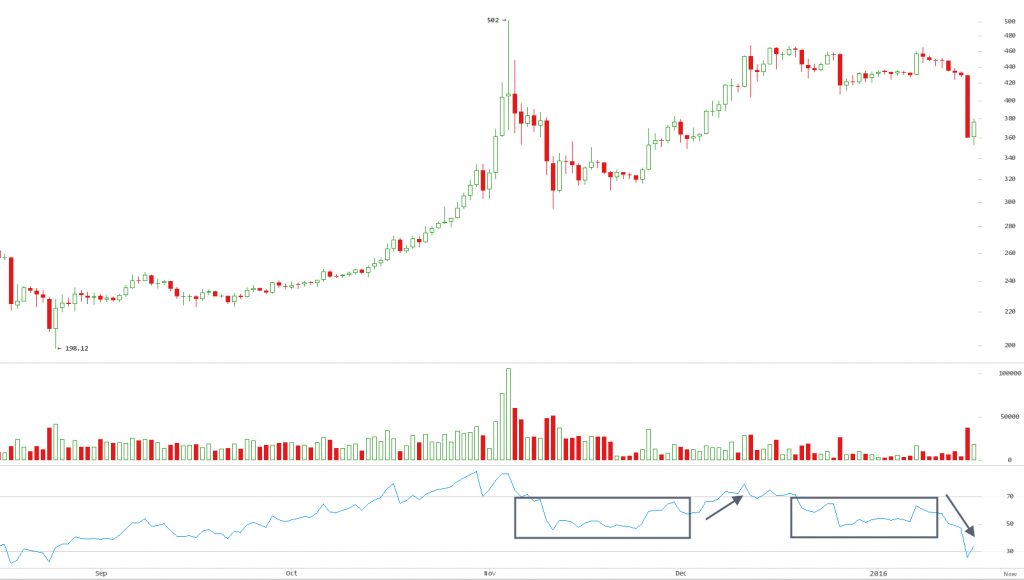
On this chart, it is evident momentum has flipped to oversold condition
(below 30), contrary to a similar pattern between November and December 2015. With benefit of hindsight, price will not go up as it did over
November. We could easily see a double dip in RSI within oversold
levels, resulting in prices dipping lower the $353 support level.
Bitcoin Price Plunges 15%, on ‘Failure’ Claims
Ex Core developer Mike Hearn, was interviewed for New York Times
article
saying “ he’d sold all his coins”. Along with his article on medium,
where he writes “Bitcoin is a failed experiment”, it has catalysed
opinions on forking, scalability issues and a toxic community.
Naturally, these sentiments led to speculation, either through panic
selling, or induced panic triggers that cascaded into self fulfilling
dumps. On January 15th, 10pm UTC, price fell off a cliff, from $431 to
$352 over the next 24 hours. Forum conversations on the protocol only
intensified the sell spiral.
The Bitcoin protocol is fundamental to this asset, systematic risks have
to be factored into price. Long term investors looking at a shot at
bitcoin, are on the fence right now.
Cryptsy claims insolvency, admits to 13,000 BTC Hack
In a newly released blog post, Cryptsy
exchange came clean on why customers have had trouble making
withdrawals. On June 2014, 13,000 BTC and 300,000 LTC totalling $9.6m
at the time, were stolen through an IRC backdoor trojan. The exchange
now says it could file for bankruptcy, with 10,000 BTC ($4.15m) in
outstanding liabilities.
The timing of this news was great for shorters, and fuelled selling
pressure on a day the market fell 18% (as of writing this) amid network
failure claims.
Ethereum surges 33% on weekly
While Bitcoin hogged the limelight, Ethercoin secretly went up 33% from
a $74,567,536 market cap to a $99,354,117 high, all in under 1 week.
As of writing this, it is trading at 0.003441 BTC, $1.28 at current USD
rates.
Interestingly, ETC trading volumes are inching closer to Litecoin. Ether
could soon surpass Litecoin as the 2nd most traded cryptocoin after
Bitcoin.
Bitcoin Weekly Price Forecast
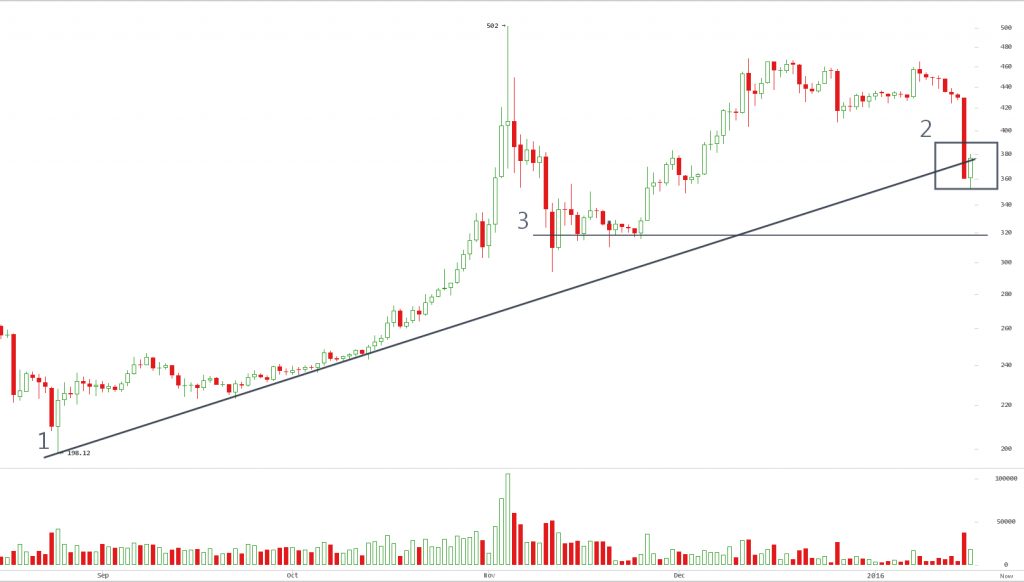
This week the price of bitcoin would seem bearish. Dumps are likely to
continue until the market finds support at $320 – $300. In this chart
(3) marks this level. Since the late August 2015 low at $198 on
bitstamp, price has respected a rising slope as support (1); so far its
has held but, it is now on the brink of breaking out at (2).
It will not succumb immediately, and we might see price linger at this
point for some days (or week), in form of consolidation rising up the
slope. Perhaps a range between $353 and $390. However, this will be
temporary, before the inevitable downtrend resumes.
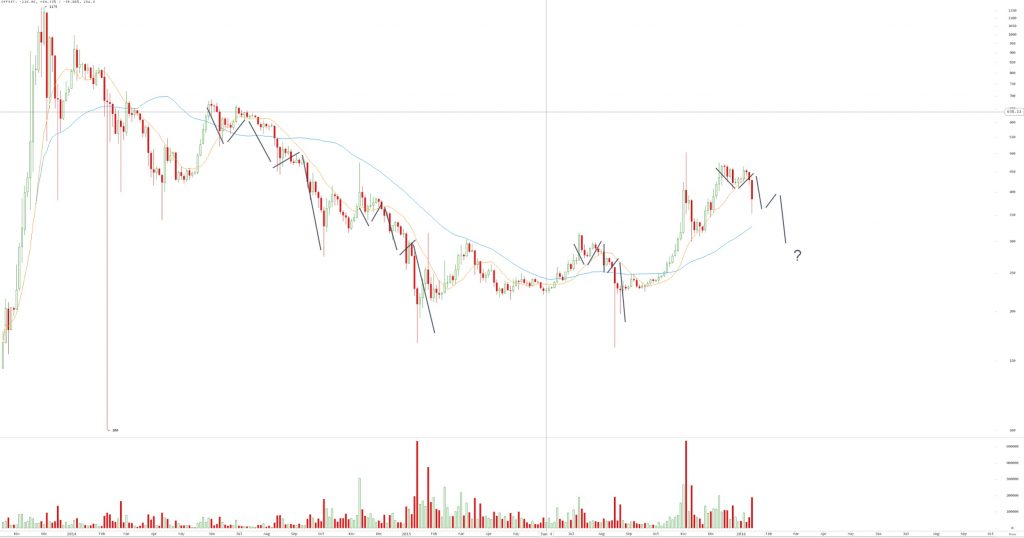
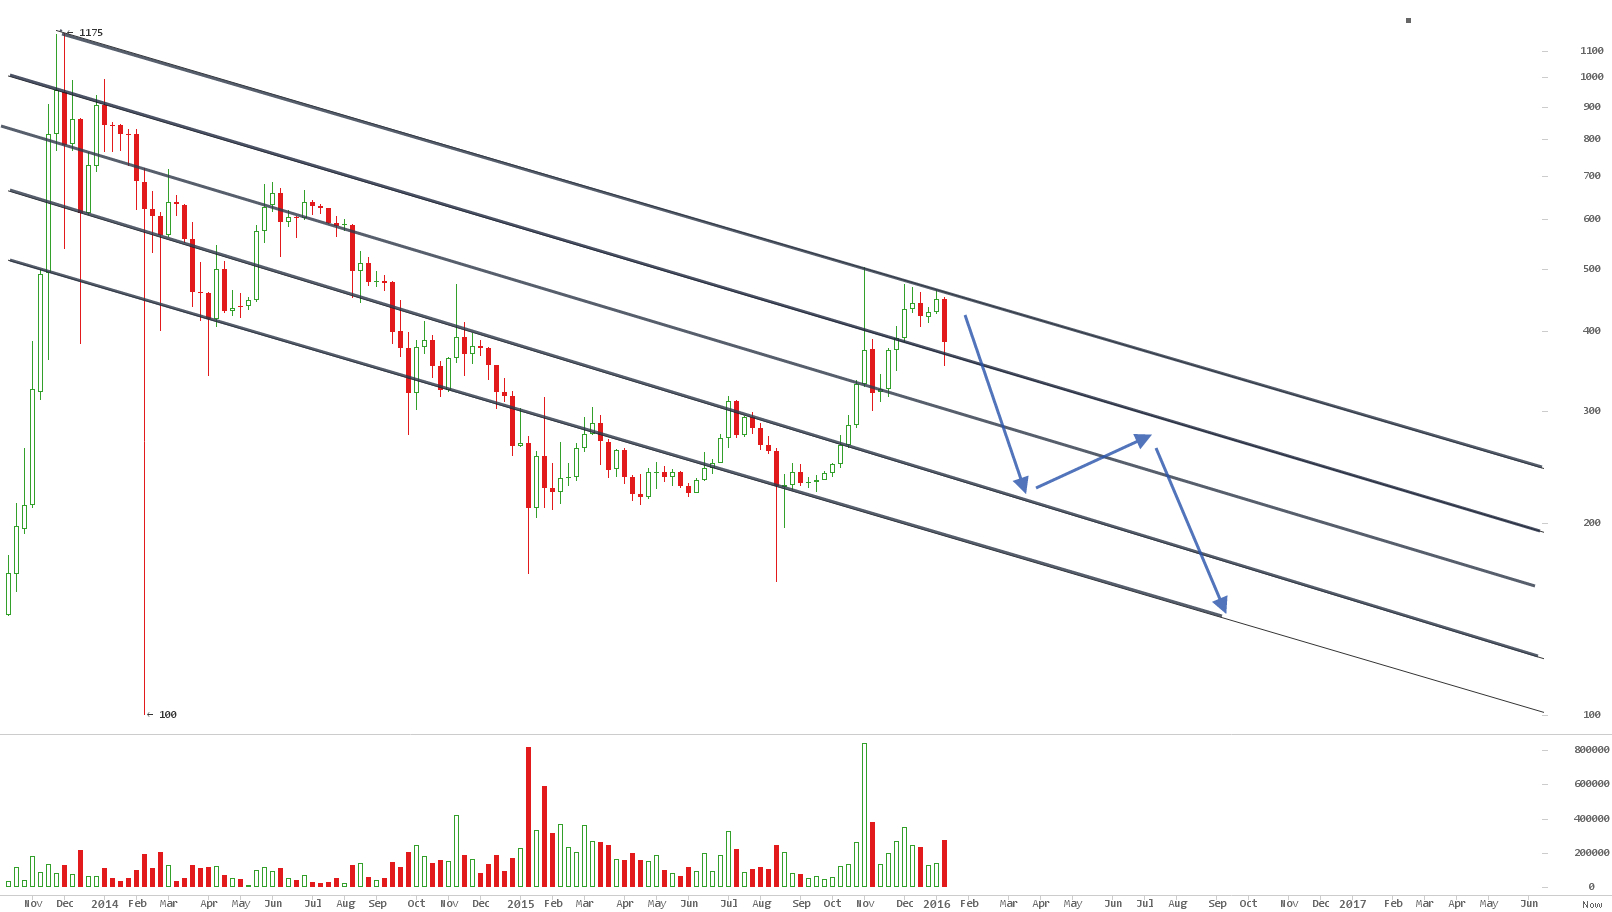
In the coming weeks, we are likely to witness 5 wave patterns down, like
previous peaks at $671 in July 2014, $475 in November 2014, and at
$316 in July 2015. 5 waves down is a common Elliott Wave pattern of
trending motive waves. The chart above highlights the double top
reversals.
With this in mind, targets on continued downtrend are $350, $300. Even
$250 is a realistic support target at this point. This week’s events
have shifted the trend to an all out bear; it is now really a matter of
picking out the bottom.

In the longer term, the blocksize debate over a soft/hard fork route
to increase capacity will continue to cast a shadow over price until it
is resolved. If this week’s events are anything to go by, forks are a
systematic risk. Bitcoin investors are aware of the potential
implications of such an event on price. Therefore, in the medium term, I
am looking at the blue arrow on this chart as a path to as low as
$200.
Perhaps an agreeable solution will be arrived at, and implemented over
the next 6 months, lining up perfectly with the block reward halving
expected in July. Just in time to lift price from a bottom.