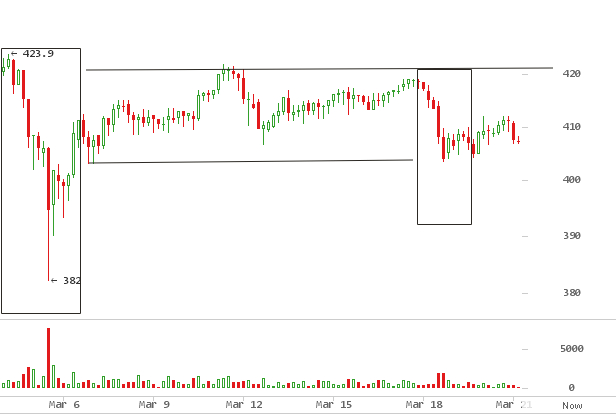
This week the price of bitcoin traded within $400 and $420 range seen
on the 4 hour chart above, moving sideways for most part of the week.
Last week’s short run up from $382 to $420 was the first attempt at
breaking $420 price ceiling. This resistance level was retested again
this week but, failed again at $419. This rejection forced priced to
retrace lower, back down to the lower limit of the trading range at
$403. As of writing this, price sits at $407, and is seemingly headed
to retest the lower $403 support again, the third time. A double bottom
on the 1 hour chart bounced off $403 and $404.
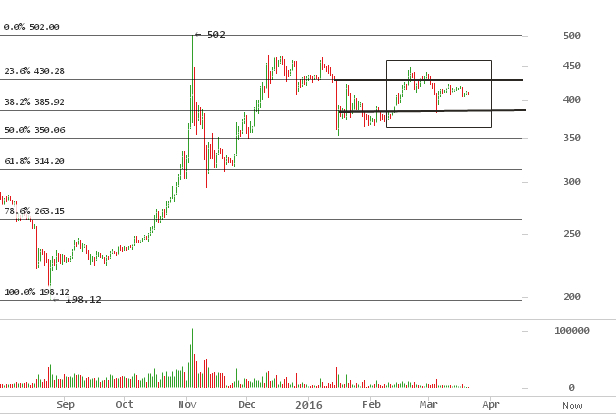
This chart above of the 1 day on Bitstamp is a fibonacci extension from
the $198 low in September 2015. It stretches up to the $504 peak in
November. Since January 14, price has been trading between $430 and
$385, 23% and 38.2% fibonacci levels respectively. This range dates
back to the beginning of 2016, with offshoots on the upper and lower
bounds. It is a decisive range, and the market seems trapped between
breaking up above $430 and heading back down below $380. Last week’s
low bounced off $382 and this week, it has mostly been trying to regain
territory. Until $430 is breached, the trend here is bearish.
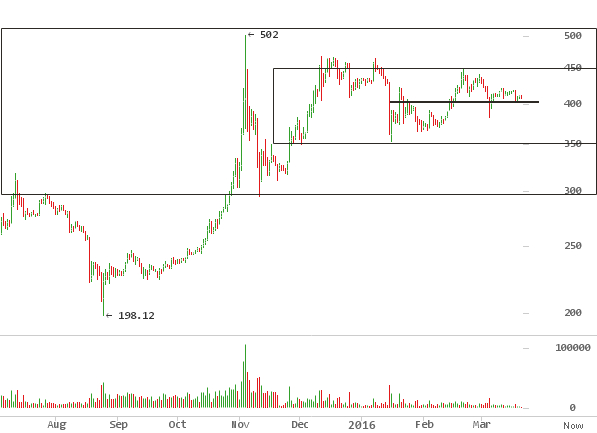
This 1 day chart above marks out the most critical levels in the coming
weeks. $430, $450 and $500 on the upside and $350 and $300 on the
downside. $400 is most significant presently, a failure to hold support
this time will fall through to $350.
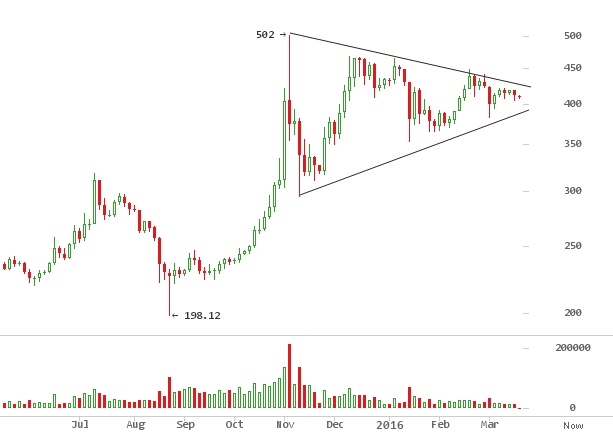
This symmetrical triangle above on the 3 day chart, with a base back in
November 2015, is still in effect and holding. Both the rising and
downward sloping trend lines are squeezing price to a converging break
out point. Price is bound to break out soon, in a matter of weeks;
question is what direction it will break.
This chart of the 1 week, captures significant price levels dating back
to June of 2015, fused with price projections on either upper or lower
breakout and marked in arrows. $680, a resistance level from June 2015,
is a reasonable upside target if price makes a bullish breakout from the
triangle. $400 level is critical, as a level that failed to break in
August through October 2015. Breaking this level would be incredibly
bullish.
The downside target is $352 first, followed by $300, a resistance
level that pushed back on price over most of 2015, until it succumbed to
buy pressure in November 2015. Resistance turned to support the same
month, and offered a firm base for a retracement to the current price
levels. A bearish breakdown will follow through $300 to a rising
trendline at $250.
Bitcoin finds a place in Mainstream Fund Portfolios
According to
Reuters,
professional traders, mutual funds, hedge funds and family wealth
offices are adding this nascent digital asset into their portfolios. Its
unique properties, growth potential and low correlation with other asset
classes, has added diversity and boosted returns.
A managing partner at London’s Ledger Capital, Jeremy Millar says the
blend of bitcoin investors is skewed
“50 to 90 percent of bitcoin’s current $6.4 billion market cap is held
by near-institutional money such as individuals at hedge funds and
family offices. That has not changed over the last two years.“
But, this is changing with the emergence of funds purely dedicated to
Bitcoin, propping up its legitimacy for investors on the sidelines.
Pantera Bitcoin Fund and Grayscale Bitcoin Investment Trust are
pioneering this neo asset class on the fringes of Wall Street.
Bitcoin boosts returns as part of a Diversified Portfolio
Grayscale Investment, sponsors of the first publicly – quoted bitcoin
securities, the Bitcoin Investment Trust, published a
report
on the impact of adding bitcoin as part of a diversified portfolio. Some
interesting patterns emerged, like a boost in returns, when compared
with portfolios without bitcoin; in particular, its low correlation with
mainstream assets and growth potential.
“Modern Portfolio Theory suggests owning non-correlated assets can help
mitigate downside risk”
Bitcoin Weekly Price Forecast
This week, price looks bullish in the short term. After bouncing off
support around $400, last week’s $382 and this week’s, $403, a retest
of upper resistance at $420 is likely, and will break after a third go
at it. The target this week is $430 zone. At this point, a downward
sloping trendline should force down price back within the triangle. The
symmetrical triangle highlighted above will drag on until uncertainty on
which direction it breaks out reaches peak.